Continuing our focus on Municipal Finance, we look at the financial statements of Srirangapatna TMC in Karnataka in this post. We are currently working with the town of Srirangapatna as a part of IFMR Finance Foundation’s Financial Access for Small Cities initiative. In this post, we examine the town’s finances over the past ten years and find similarities to national trends.
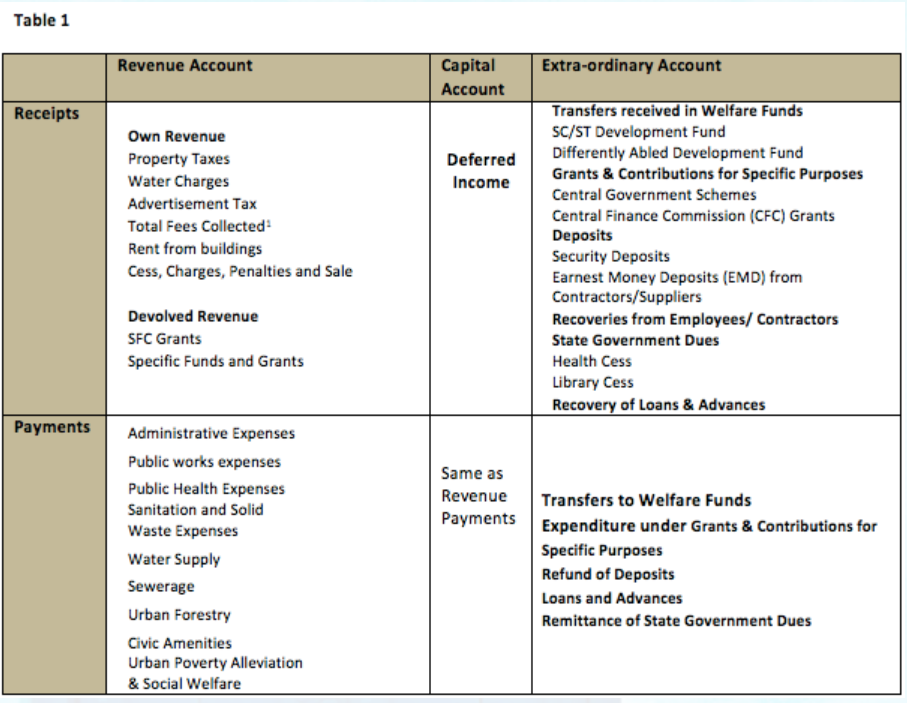
The financial books of Srirangapatna Town Municipal Council (TMC) comprise three accounts- revenue receipts/payments, capital receipts/payments and extra-ordinary receipts/payments. Table 1 presents an overview of heads that are classified under each account.
The key findings from our analysis are summarized below2:
i. Dramatic Increase in Total Income and Expenditure: The finances of Srirangapatna TMC have witnessed dramatic growth over the past decade. For instance, total Income has increased from Rs. 4.22 million in FY 2000-01 to Rs. 141 million in FY 2010-11 (see Figure 1). The city ran a surplus budget for most of the previous decade, except FYs 2007-08 and 2009-10 when the city ran a deficit budget3. This seems to be part of a wider trend in Karnataka, where 90% of the TMCs have surplus budgets4.
The last FY (2010-11) saw a large increase in both total Income and total expenditure; total Income doubled over the previous FY. This large spike is explained by two items in the city’s accounts. First, the city’s capital receipts account shows a deferred income of Rs, 39.5 million received under the head of public works. Second, the city received a development grant of Rs. 33.3 million under extra-ordinary receipts.
On average, the city’s income has exceeded its expenditure by a factor of 1.23. According to the Third Karnataka State Finance Commission (SFC), on average a TMC’s income exceeds its expenditure by a factor of 1.78. (For a deeper analysis of Kanataka’s third SFC, refer to our blog post on Funds devolution from state governments to ULBs)

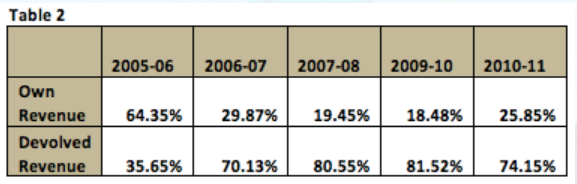
ii. Increasing share of devolved revenue: Table 2 shows how the share of own and devolved revenue has changed over the past five years. In FY 2010-11, devolved revenue formed 74% of total revenue. The table shows that the proportion of devolved revenue saw a rapid increase in FY 2006-07; it rose from 35% in FY 2005-06 to 70% in FY 2006-07. This rise can be attributed to an untied SFC grant of Rs. 10 million that the TMC received in FY 2006-07.
Since 2006-07, the TMC has received an average of Rs. 15.61 million as untied SFC grants each year, which explains the increasing share of devolved revenue. This is similar to the trend seen across smaller ULBs in Karnataka. For instance, on average devolved revenue forms 71% of a TMC’s total income in Karnataka. This trend is also seen nationally where the share of own revenue in the income of ULBs has declined from 63.48% in 2002-03 to 54.94% in 2007-085. (For a detailed discussion on national level trends, refer to our blog post on Municipal Finance-Funds)
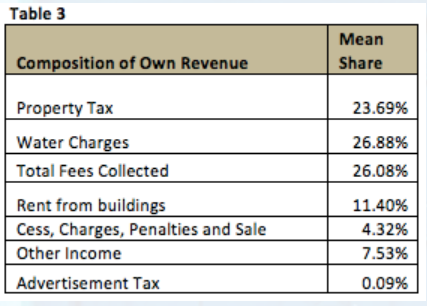
iii. Declining revenue from property tax: Table 3 shows the mean composition of own revenue over the past five years. Property Tax, Water Charges and Fees collected form 76% of own revenue. As the third SFC notes, property taxes form the largest source of own revenue for TMCs in Karnataka, forming 12% of total revenue (as of 2007). However, over the past five years, the share of property taxes in Srirangapatna’s total revenue has reduced to 7.5% in 2010-11 from 11% in 2005-06. The own revenue of the city is heavily reliant of a variety of fees that are collected; in 2010-11 total fees collected formed a third of own revenue.
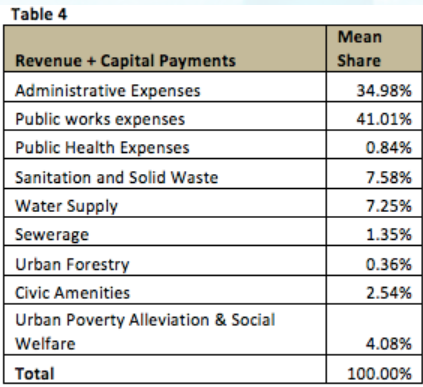
iv. Administrative expenses forms 35% of total expenditure: Administrative expenses make up a large portion of the TMC’s total expenditure. Salaries, Allowances and collection of taxes form 41.69% of total expenditure of TMCs in Karnataka. This true of larger ULBs as well, for instance, Mohanty (2007)6 finds that establishment and administrative expenditure make up 36% of total expenditure in a study of 35 Municipal Corporations.
Public work expenses form about 41% (see Table 4) and hence, the largest expenditure item for the TMC. Public works comprises work undertaken on roads, pavements, footpaths, drains and street lights. Although their mean shares are small, expenditure on sanitation, water supply and urban poverty alleviation have increased. For instance, the TMC spent 17%, 16% and 10% of the total budget on sanitation, water supply and urban poverty alleviation respectively in 2010-11.
v. Sound fiscal health and High level of under-spending: The TMC seems to have been in sound fiscal health over the past decade. Even in years where the city’s budget ran a deficit, it had closing balances of Rs. 27.14 million (2007-08) and Rs. 44.17 million (2009-10). In FY 2010-11, the city had a surplus of Rs. 49.1 million, resulting in a closing balance of about Rs. 95.73 million.
As we found in our State of Srirangapatna report 20127, the city has many areas of opportunity that require spending from the TMC. For instance, the city has a serious sanitation issue- 39% of the households surveyed reported that they defecated in the open. 50% cited the lack of availability of public toilets as the reason for defecating in the open. As Table 4 shows, the city spends only 7.5% of its budget on sanitation and solid waste management combined.
This reflects a broader trend that is seen across ULBs in India. For example, Mohanty (2007) finds that municipal corporations in India are characterized by sound fiscal health and high levels of under-spending. The study finds that the level of under-spending on core services (as compared to the norms set by the Zakaria Committee) is 76%. Heavy dependence on upper tier of government (as seen by the over-whelming share of devolved revenue) and inability to raise revenues on their own hamper delivery of basic services.
Note: Budget Statements of the last three years are available on the TMC’s official website: http://www.srirangapatnatown.gov.in/
—
- Total fees comprises fees charged under the head of planning and regulation; these include building regulation fees, town planning fees, jatra/urs fees, development charges, parking fees and fees collected from grounds rented out for civic purposes
- Data for FY 2008-09 is missing from the analysis
- The city had a deficit of Rs. 3.14 lacs in 2007-08 and Rs. 25.09 lacs in 2009-10.
- Source: Report of the Third State Finance Commission, Government of Karnataka. Available at: http://www.finance.kar.nic.in/others/TSFC%20Report-English-Full.pdf
- Report of the Thirteenth Finance Commission (2010-2015). Finance Commission, India. December 2009
- Mohanty, P.K et al. Municipal Finance in India: An Assessment. Development Research Group, Reserve Bank of India. December 2007
- A summary is available here: http://financingcities.ifmr.co.in/SOS_Summary.pdf