In this third post under the series “Understanding the KGFS Customer” we present data regarding expenditure patterns of rural households enrolled with KGFS. We also try to understand what the Planning Commission’s recently proposed poverty line cut-off (Rs.26 per person per day expenditure in rural areas) means for the average KGFS customer.
Notes:
- This blog post displays data of all enrolled households of the three KGFSs, Pudhuaaru (Tamil Nadu), Dhanei (Orissa) and Sahastradhara (Uttarakhand), obtained from the datasets of the Customer Management System (CMS).
- Data considered for this post is as of October 5th, 2011. The information is as declared by the customer at the time of enrolment or at the time of any periodic updating of data.
- Customers can enrol at any time during the year and hence the data collected is at different points in time.
- Data for expenses is captured household-wise (as against individual customer-wise). Pudhuaaru has 79,120 enrolled households, Dhanei has 18,216 and Sahastradhara has 17,513 which brings the number to a total of 114,849 households. There may be more than one customer per household; hence the total number of customers is much higher.
- With respect to household expenses, the CMS database contains data on expenses on food, clothing, health, travel, electricity, telephone and festivals. Expenses in the ‘others’ category includes rent, cable connection charges, and miscellaneous cash outflows as declared by the customer.
- It is important to note that recall periods vary for each category. The CMS database includes options for daily, weekly, monthly, quarterly and annual frequencies for every expenditure category and the frequency is chosen based on one at which the customer recalls expenditure accurately.
- Throughout the post we have used the term Monthly Per capita Consumption Expenditure (MPCE) which is the household expenditure per month divided by number of members in the household.
The distribution of Monthly Per capita Consumption Expenditure (MPCE) for an average household for the three geographies is shown in the graph below. Pudhuaaru has the highest average MPCE at Rs.837, followed by Dhanei (Rs.625) and Sahastradhara (Rs.618). We can observe that the overall expenditure is highest on food lowest on telephone across all three geographies.
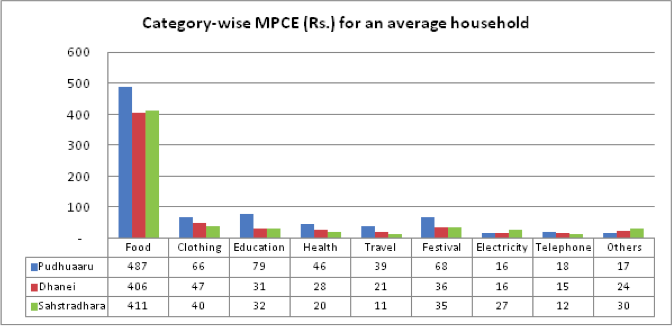
Expenses on education and festivals are almost double (Rs.79 and Rs.68) in Pudhuaaru compared to that of Dhanei (Rs.31 and Rs.36) and Sahastradhara (Rs.32 and Rs.35). In rural areas of Thanjavur where Pudhuaaru KGFS operates, expenses on travel are higher as compared to rural Ganjam (Dhanei) and rural Garhwal (Sahastradhara). Electricity and ‘others’ are the only two categories where MPCE is higher for Dhanei and Sahastradhara as compared to Pudhuaaru.
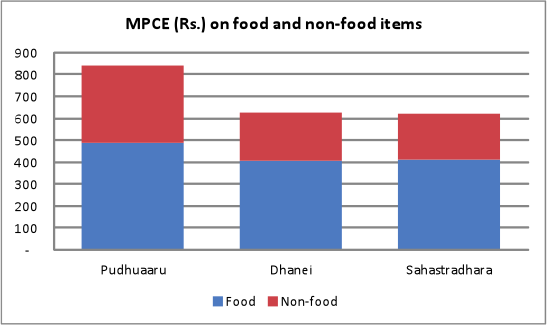
The break-up of the average MPCE on food and non-food items is given in graph below. It is interesting to note that in absolute terms, the MPCE on food items is highest in Pudhuaaru, followed by Sahastradhara and Dhanei. However, non-food items have a greater share in the average household’s overall MPCE for Pudhuaaru as compared to Dhanei and Sahastradhara.
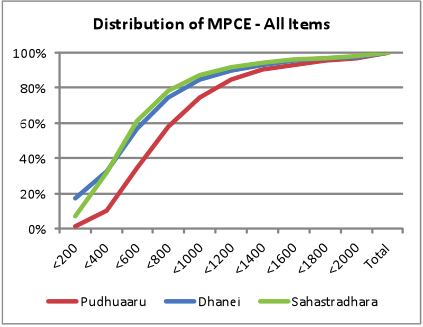
The 3 graphs below show the percentage-wise distribution of MPCE figures for KGFS customers. Overall, 62% of the enrolled households have a per capita daily expenditure of less than or equal to Rs.26 (monthly Rs. 780) which is the proposed poverty line definition of the Planning Commission. In Pudhuaaru, approximately 58% of the households have an overall MPCE of less than or equal to Rs.780. This number increases to 75% for Dhanei and 78% for Sahastradhara.
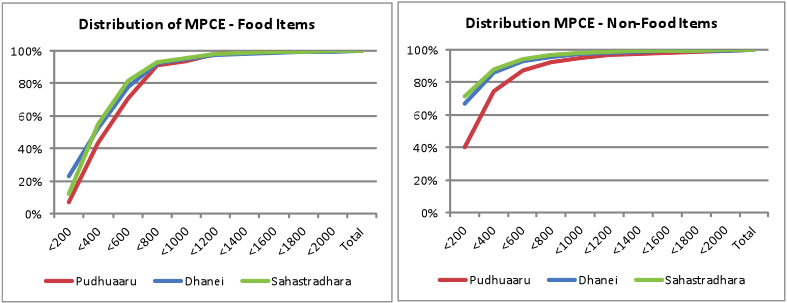
For food items alone in the below graph, 91% of the households in Pudhuaaru have an MPCE of less than or equal to Rs.780. This number increases only slightly to 92% for Dhanei and 93% for Sahastradhara.
The graphs below show the distribution of MPCE by income quartiles and by geography. Overall, MPCE increases with increase in income and the difference is the greatest between the third and the fourth quartile.
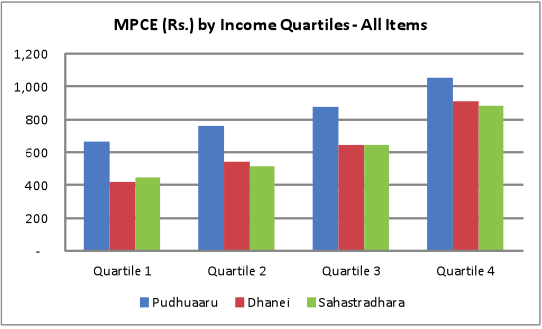
However, as we can see in the below graphs, MPCE on food items increases at a slower rate than non-food items as income increases. In other words, richer customers are spending a lesser proportion of their overall expenditure on food as compared to non-food items.


One Response
Thank you very much for posting a thought provoking article. One of the important points sufficiency of food to take care of the nutritional needs of the people.Unless the nutritional intake and break up of food items(both purchased and self grown) is given the inferences are likely to have limitations.Similarly regarding education, what is the type of schooling opted by them is also important. If it is government schools then there is no fee and they are covered by midday meals scheme and the expenditure will tend to be lower. One important point is how many households are covered by PDS? It if the household is covered by PDS, then the expenditure is likely to be less as the family is likely to get the rice free ( at least in Tamilnadu). The villages are not homogeneous in access towards different services and combining them may not be appropriate. However, i appreciate your initiative.