In the earlier research brief, we tracked the formal savings potential of the households over 6 years from 2014 to 2019. We found that, on average, 75-80% of households manage to maintain a positive surplus. Moreover, the surplus rate of the households that maintain a positive surplus is approximately 40%. We also found that this surplus rate has been increasing over time, in contrast with the household savings rate of the country, which has been falling over time.
In this blog post, we explore how the households’ surplus changed during the nationwide lockdown[1] imposed to curb the spread of COVID-19. The impositions were much stricter in April and May 2020.[2] Hence, its impact on the livelihoods of households is expected to be the greatest in these months.
Income and Surplus
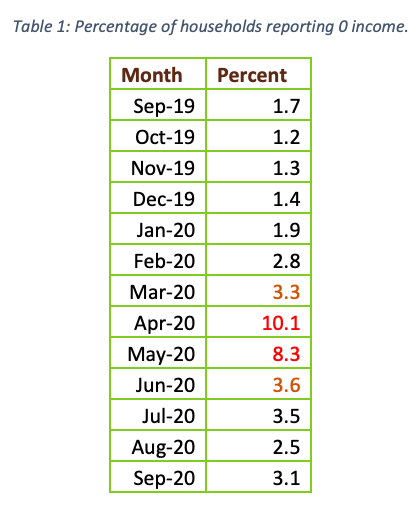
We find that the percentage of households having no income increased drastically in April 2020 and May 2020 to 10% and 8%, respectively, from less than 2% in January 2020 (Table 1).[3] This observation is similar to the findings from other surveys[4] that were conducted to study the impact of COVID-19 on the livelihoods of households. Moreover, Bertrand, Krishnan and Schofield 2020, also find that almost 84% of households reported a decrease in income. These observations are consistent with the spike in the unemployment rate registered during April. The unemployment rate peaked at nearly 25% in April 2020 from 8.8% in March 2020 (Bertrand, Dizon-Ross, et al. 2020). However, the percentage of households reporting 0 total income started reducing in June 2020 (Table 1), as did the unemployment rate (Bertrand, Dizon-Ross, et al. 2020).
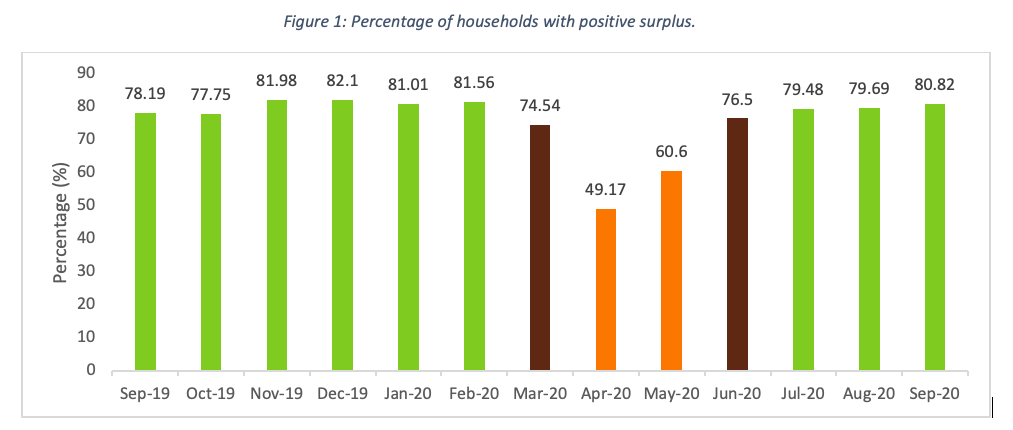
This increase in the percentage of households not earning any income in the peak lockdown months also led to a sharp decline in households managing a surplus. The percentage of households reporting positive surplus fell drastically from around 80% in February 2020 to less than 50% in April 2020 (Figure 1). This is also consistent with Dvara Research and CMIE (2020) joint findings on the impact of COVID-19 on access to cash and coping strategies. The study finds that cash deposits made to different financial institutions fell drastically from about 52% to 32% and 18% respectively in April and May 2020, indicating lower savings.
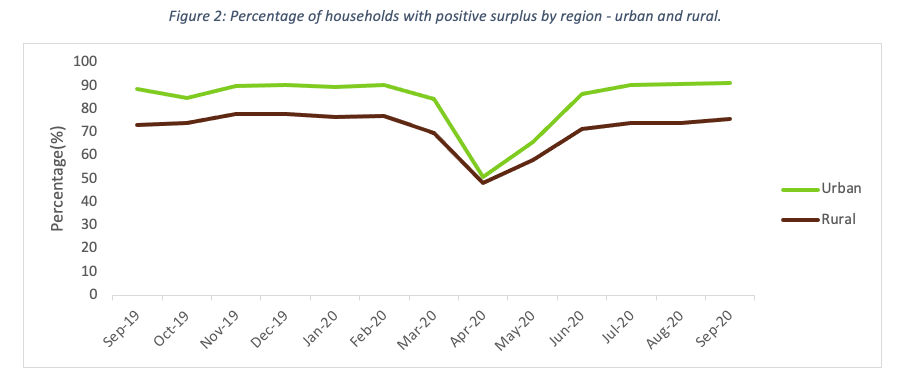
We also find that the urban households were affected more than rural households as the percentage of households managing a positive surplus fell by 40% in urban areas (Figure 2). It fell from about 91% in February 2020 to 51% in April 2020 in urban areas. On the other hand, the fall in the percentage of positively saving households in rural areas was 30%. This could be because the loss of livelihood was more prominent for urban households than rural households in April and May 2020. According to a survey conducted by Azim Premji University (2020), between April and May 2020, a higher percentage of urban workers lost their employment than their rural counterparts. Agrawal and Ashraf (2020) found that a lesser percentage of urban households were employed during round 1 and round 2 of their survey than rural households. They also found that though the situation improved in June, the employment growth mostly happened in rural regions. One reason they give for this is MGNREGA, applications for which thoroughly increased during this period. This could also be corroborated by Peoples’ Action for Employment Guarantee (2020), who found that 43% more person days were generated in 2020 than 2019 under MGNREGA.[5] Our findings are also consistent with the State of Working India report by Azim Premji University (2021). They find that the decline in income was more striking for urban areas than rural areas as urban areas saw a 50% fall in income in April 2020 as opposed to February 2020, whereas for rural areas, it was a 39% decline.[6] Moreover, agriculture is a prominent source of income for rural households, and farming saw an increase in employment in April 2020, according to CMIE (2020), indicating that people returned to farms when other sectors started laying off.
Income-quintile analysis
For our analysis, we divided households into income quintiles based on their average monthly income in 2019. The average monthly income was calculated by dividing the sum of income earned by households in each month of 2019 by the total number of months in 2019 for which data was available for the household.[7] The final analysis was conducted on 1,34,83,792 weighted households.
This division was then used to explore the changes in income and surplus of the households in each month from September 2019 to September 2020. One reason for doing this is that it helps us study the same households over time.
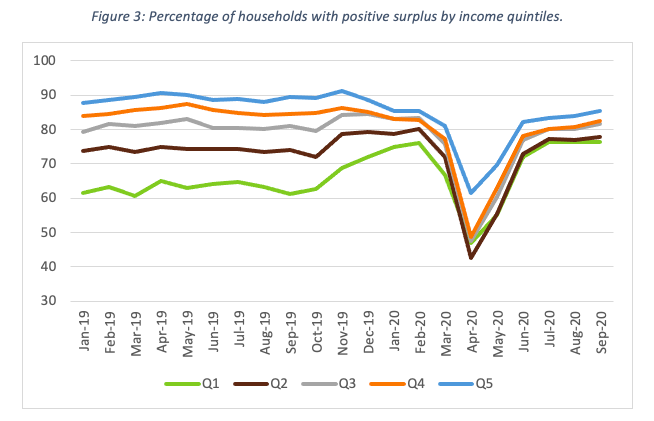
We find that the percentage of households managing a surplus dropped for households in each income quintile during the April and May 2020 period (Figure 3). The households that were the most affected belonged to the bottom four income quintiles, for which the percentage of households maintaining a surplus dropped below 50%. Whereas, though the percentage of households maintaining a surplus in income quintile 5 also dropped to 62%, the drop was not as high as those in the lower income quintiles. However, the percentage of households maintaining a positive surplus regained strength in June 2020 for all income quintiles indicating that this sudden drop was due to the strict lockdown that was enforced.
Median Income and Median Savings of Households
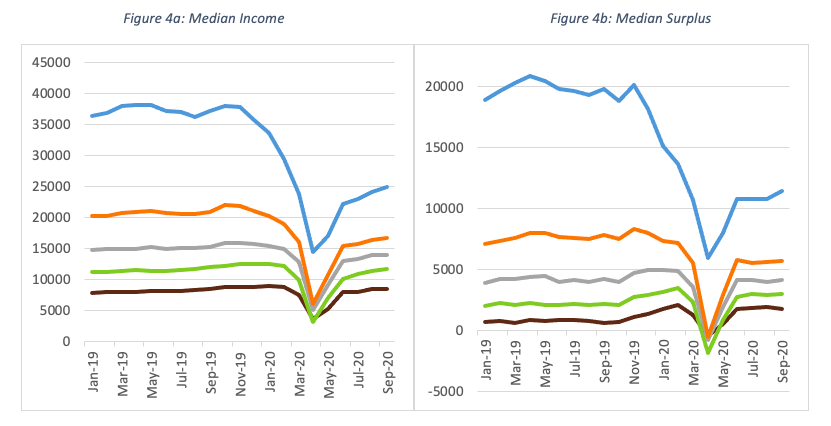
Figures 4a and 4b show that there is some correlation between median income earned by households in each quintile and the median surplus that they manage to maintain.[8] Both fell drastically during the strict lockdown months of 2020. A median Q1 household earned approximately Rs. 8,500 per month in 2019 as opposed to only Rs. 3,650 in April 2020. However, the worst hit was the median quintile 2 household with a drop of almost 73% from approximately Rs. 12,000 in 2019 to Rs. 3,250 in April 2020.
Similarly, all households in different income quintiles except Q5 saw a negative surplus, with a median Q4 household experiencing the highest drop from Rs. 7200 in Feb 2020 to a negative surplus of Rs. 540 in April 2020. Azim Premji University (2021) also found a larger decline in incomes for lower deciles in both rural and urban regions in April and May 2020.
Further, though lower income quintiles were the worst hit in April and May, they began returning to their initial levels in June 2020. However, for Q5 households, this drop in the median income and surplus remained much below their initial levels until September 2020. A potential reason could be that most households in Q5 have members working in the formal sector.[9] The formal sector laid off multiple individuals, and most companies froze hiring. According to an article by Mahesh Vyas, CMIE (2020), almost 18% of salaried employees lost their jobs in April 2020. It takes a significant amount of time for those who are laid off to get back in the job market, especially when most companies have frozen hiring.[10]
Surplus Rate of the Households Reporting Positive Surplus
Looking at the households who managed to maintain a positive surplus,[11] we find that the overall savings rate of the households increased from 42% in February to 52% in April (Figure 5). This is potentially because households who could save during the months of lockdown saved more than usual, due to limited spending avenues during the strict lockdown months. The estimates from the RBI[12] also found that the household financial savings rate was at a high of 21% in the first quarter of the financial year 2020-21. A similar trend can be seen for urban and rural households.

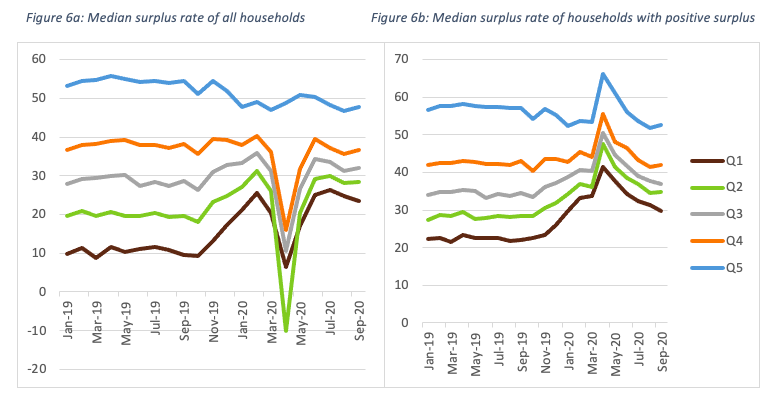
Further bifurcating households based on income quintiles, we find that the median surplus rate of households that exhibited positive surplus increased in April 2020 (Figure 6b). This contrasts with the picture for all households (Figure 6a), where we see that except for the highest income quintile households, all households witnessed a sharp decline in their surplus rates in the peak lockdown months, especially for Q2 households.
Year-on-year State-wise Analysis
Finally, we look at India-wide heatmaps to study the differences in the percentage of households reporting positive savings across different states. We also map both graphs from 2019 and 2020 to compare across time.[13]

Looking at Figures 7a and 7b, we find that the percentage of households reporting positive surplus decreased drastically in several states in April 2020 from that in April 2019. The states which reported the highest decline in the percentage of households reporting positive surplus in April 2020 in comparison with April 2019 are Meghalaya (60 percentage point drop), Puducherry (57 percentage point drop), Tamil Nadu (43 percentage point drop), Delhi (43 percentage point drop), Jharkhand (39 percentage point drop), Bihar (38 percentage point drop), Chhattisgarh (37 percentage point drop), and Madhya Pradesh (31 percentage point drop).[14] However, the percentage of households managing a surplus increased in June 2020 and almost reached the pre-COVID levels for most states.[15]
This is consistent with the findings of Bertrand, Dizon-Ross, et al. 2020, as they find that the income losses were the highest for Chhattisgarh, Puducherry, Delhi, and Tamil Nadu in April 2020 as compared with April 2019.
Key Takeaways
We find that household surplus was the most affected in April and May 2020. This is because most households lost their jobs and sources of income due to the strict lockdown imposed to curb the spread of COVID-19. However, the household surplus started recovering to its pre-lockdown level in June, when the impositions of the lockdown were considerably eased.
The impact on household surplus was the highest on the lowest income quintile households. But almost all income quintiles started recovering in June 2020, whereas the impact on the highest income quintile households remained. We conjecture that the potential reasons behind this could be the numerous layoffs, frozen hiring, and pay cuts in the white-collar job market in that period.
The estimates from the RBI also reveal that the household financial savings rate was at a high of 21% in the first quarter of the financial year 2020-21. This is in accordance with our analysis, as the median surplus rate of those households who were able to maintain a positive surplus increased, across all income quintiles.
To understand how households dealt with the economic shock, we use the findings from the statistical handbook created jointly by Dvara Research and CMIE (2020). It finds that households’ most common coping strategy during the lockdown was using cash or bank savings already held by them. This seems plausible as a high percentage of households reported having no income during the lockdown. Many households also resorted to unhealthy coping measures such as skipping meals or reducing the size of their meals. Many also relied on less preferred or less expensive foods, and some even borrowed food or took other non-monetary help from friends, among others.
The percentage of households that skipped meals or reduced the portion of their meals shot up to 11% in April-July 2020 from 2% in January-March 2020. Whereas 45% of households relied on less preferred or less expensive foods in the lockdown months, as compared to only 13% in the first quarter of 2020. Further, almost 10% of households borrowed food or took non-monetary help from friends or family during the lockdown months than only 2% in the first quarter of 2020.
These figures are much worse for the lowest income households. The percentage of households that skipped meals or reduced the size of the meals went up to 16% in April-July 2020 from less than 2% for the lowest income earning households. Similarly, the percentage of the lowest income earning households relying on less preferred or less expensive foods shot up to 57% in the lockdown months from 11%. Non-monetary borrowings also increased from 2% to 13% in the lockdown months, indicating that the hardships faced by the lowest income earning households were much higher than the households belonging to higher income groups. Moreover, rural low-income households had the highest incidence of reducing consumption during the lockdown.
This blog provides evidence to substantiate the economic hardships faced by households during the strict lockdown months of 2020. With the loss of income, low-income households had to resort to their existing savings to cope. However, this was not an option available to all. Therefore, some households even had to resort to extreme measures such as reducing consumption of necessities such as food, which was the most common for the rural low-income households. Moreover, the hardships faced by the highest income quintile households remained further beyond the strict lockdown months, as neither the median income, nor the median surplus recovered fully post June 2020.
It is also important to note that though the surplus rates almost quickly recovered for the lowest income quintile households after lifting of the lockdown restrictions, they might still experience a long-term impact because of depleted savings, or incurred debt, especially with respect to the second wave of COVID-19 (Azim Premji University 2021). These, coupled with the coping strategies adopted by the households, can have serious implications on households’ food security, education, and health.
[1] https://www.pib.gov.in/PressReleasePage.aspx?PRID=1608009
[2] Certain relaxations were announced by the Government after the strict lockdown. For a comprehensive list of relaxations, refer to: https://bit.ly/3dy5fDS; Phased re-opening of activities outside Containment zones that were effective from June 1, 2020: https:// pib.gov.in/PressReleasePage.aspx?PRID=1627965
[3] To get the effect on total income, we do not drop the households reporting 0 total income for this analysis. Also, to contrast the findings for both pre-COVID and post-COVID, we report the results from September 2019 to September 2020.
[4] This dashboard by the Social Protection Initiative at Dvara Research lists the findings from its panel survey: https://dvararesearch.com/social-protection-initiative/covid-19-impact-on-daily-life/; Agrawal and Ashraf 2020 lists and compares the findings from other studies as well. All these studies find a massive loss of livelihoods for individuals during the months of April and May 2020.
[5] Most of this increase was concentrated in the months of May, June, and July 2020.
[6] Rural incomes are seasonally adjusted.
[7] It is important to note that the sample size was smaller in 2020, specifically in the lockdown months. Hence, applying weights to the sample for each month, and conducting the analysis at the level of the population, is necessary for meaningful comparability across months.
[8] The reason why we take median income and surplus is because the distributions for income and surplus are highly skewed. In such scenarios, the preferred indicator of central tendency is median as it is more resilient to outliers than mean. Refer to appendix tables to look at the distribution.
[9] More than 30% households in Q5 are white-collar or salaried employees as in April 2019.
[10] Almost complete hiring freeze was experienced for white-collar employees in aviation, tourism, hospitality, e-commerce, media, logistics, real estate, and construction: https://www.livemint.com/news/india/white-collar-jobs-that-sinking-feeling-11589213057790.html; Other key industries that showed a decline in hiring are retail, auto/auto ancillary, pharma, insurance, accounting/finance, IT-software, and BFSI: https://gulfnews.com/world/asia/india/covid-19-impact-after-job-cuts-hiring-freeze-set-to-kill-a-million-dreams-in-india-1.1587459389888
[11] Surplus rate is given by dividing the surplus by income and multiplying it by 100.
[12] https://rbidocs.rbi.org.in/rdocs/Bulletin/PDFs/04AR_190320212E0855E3FD1C4C47A98B1F47EDE0FA44.PDF
[13] By doing a year-on-year analysis we have also taken care of the seasonal variations that may arise in specific months.
[14] We do not explore the reasons behind a significant increase in the percentage of households reporting positive surplus in J&K and Ladakh from April 2019 to April 2020.
[15] We haven’t directly correlated these to the severity of lockdown in states and we do not see any linear relation based on the secondary sources that we refer to either.
References
Agrawal, Niyati, and Hasna Ashraf. 2020. COVID-19 Impact on Daily Life (CIDL) Survey. June 18. check here.
Azim Premji University. 2020. COVID19 Livelihoods Phone Survey. https://cse.azimpremjiuniversity.edu.in/cse-surveys/covid19-livelihoods-phone-survey/.
—. 2021. State of Working India 2021. https://cse.azimpremjiuniversity.edu.in/wp-content/uploads/2021/05/State_of_Working_India_2021-One_year_of_Covid-19.pdf.
Bertrand, Marianne, Kaushik Krishnan, and Heather Schofield. 2020. How are Indian Households Coping Under the COVID-19 Lockdown? 8 Key Findings. May 11. https://www.chicagobooth.edu/research/rustandy/blog/2020/how-are-indian-households-coping-under-the-covid19-lockdown.
Bertrand, Marianne, Rebecca Dizon-Ross, Kaushik Krishnan, and Heather Schofield. 2020. Employment, Income, and Consumption in India During and After the Lockdown: A V-Shape Recovery?. November 18. https://www.chicagobooth.edu/research/rustandy/blog/2020/employment-income-and-consumption-in-india-during-and-after-the-lockdown.
CMIE. 2020. The jobs bloodbath of April 2020. May 5. https://www.cmie.com/kommon/bin/sr.php?kall=warticle&dt=2020-05-05%2008:22:21&msec=776.
Dvara Research and CMIE. 2020. “Statistical Data Tables on the Impact of COVID-19 on Access to Cash and Coping Strategies.”
Peoples’ Action for Employment Guarantee (PAEG). 2020. NREGA National Tracker December 2020. December. https://www.indiaspend.com/uploads/2020/12/23/file_upload-364421.pdf.
Cite this item
APA
Agrawal, N. (2021). Household Savings in the Time of COVID-19. Retrieved from Dvara Research Blog.
Chicago
Agrawal, Niyati. 2021. “Household Savings in the Time of COVID-19.” Dvara Research Blog.
MLA
Agrawal, Niyati. “Household Savings in the Time of COVID-19.” 2021. Dvara Research Blog.