Rosenberg et al. recently published a report on Microcredit Interest Rates and Their Determinants covering the period 2004 to 20111. The report aggregates financial data for microlenders reporting to MIX2 and comments on the trend and determinants of microcredit interest rates across different geographical regions. This post compares the observations in the report with the MFI model developed by Chaudhary and Rai3.
While the study by Rosenberg et al. is an empirical report on the trends in the microcredit sector, Chaudhary and Rai’s MFI model is a theoretical exercise in modelling the operations of a microlender. Putting the two studies side by side gives an opportunity to analyse the model predictions with empirical data.
Rosenberg et al.’s earlier study was based on a constant sample of 175 microlenders from 2003-2006. The previous study gave insights into the evolution of a constant set of typical microlenders. The current study is based on microlenders that reported data any time from 2004 to 2011. Hence, the sample is not constant and accordingly, the study shows how the whole market has evolved over the period of study.
The study breaks microcredit interest rates into cost of funds, loan loss expense, operating expense and profits, and the trend in each component is analysed. The study thus uses income from loans as a proxy for microcredit interest rates. The authors acknowledge that income from loans may not be a true reflection of the cost to microborrowers as a third of them had some form of compulsory savings with the lenders. The other problems in using income from loans are that they may club different products, and the gross loan portfolio (GLP) denominator may not have been adjusted for overdues. However, because of data unavailability and the gap between interest yield and APR expected to be “relatively stable”, the authors used income from loans as a proxy for APRs.
Results of the study and comparison with the MFI model
Operating expenses have declined but not in the same magnitude as suggested by the MFI model
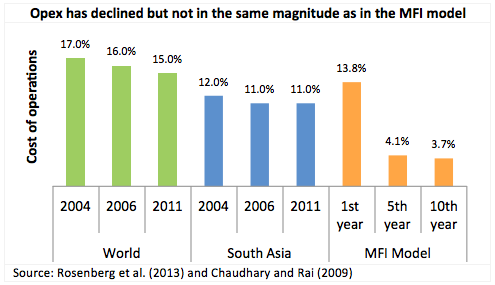
Operating cost (opex), the largest determinant of microcredit interest rates, has declined from 17 per cent in 2004 to 14 per cent in 2011. The opex declined rapidly from 2004 to 2007. Post 2008 however, the decline in opex has moderated. Geographically, costs have come down more in newer markets like Africa and East Asia Pacific as compared to other developed markets.
Broadly, these trends are seconded by the MFI model wherein cost of operations shows a declining trend as capacity utilization increases and operations mature. Also, we would expect newer markets to show the largest decline in opex as they reap higher benefits of economies of scale.
The magnitude of decline in opex however falls short of the model prediction. Since the regional focus of the two studies are different, only the magnitude of the change in opex and not the level of opex can be compared. In the full sample, the opex for microlenders has declined from 17 per cent to 15 per cent with the bulk of the decline coming during the period 2004 to 2007. In the sample for South Asia, the opex shows only a marginal decline from 12 per cent to 11 per cent during the same period. The MFI model shows a much larger decline for its Twenty Branch Unit (TBU) sample4, with the cost of operations declining from 14 per cent in the first year of operation to 4 per cent in just five years of operation.

The deviation in the decline in opex between the two studies could be attributed to the adjustment for growth in the MFI model for opex but not in the empirical study. Chaudhary and Rai analyse opex under a zero growth model, i.e., for only a single twenty business unit (TBU) setup across fifteen years. The paper by Rosenberg et al. however reports aggregated operating expenses without adjustments for expansion. The raw operating expenses as reported by microlenders include expenditure on branch expansion and thus are not a true reflection of the actual running cost of a microlender. Such operating expenses, when pruned for expansion costs, will expectedly be more in line with the predictions of the MFI model.
Lower decline in interest yield than what is suggested by the MFI model has not translated to higher return on equity
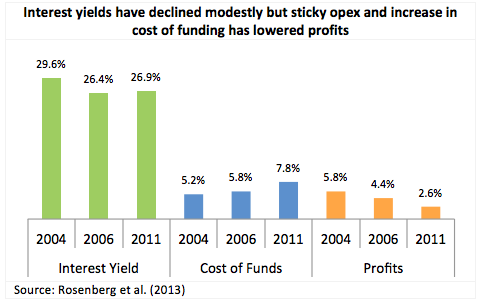
The median interest yield as reported by Rosenberg et al. has declined over the years to 27 per cent in 2011. Based on the MFI model, the rate of decline in interest yield is lower than expected. The higher interest yield however has not translated to high return on shareholders’ funds with the median return on equity of less than 10 per cent in 2011. The less than expected decline in opex and the increased cost of borrowing5 has not only manifested in lower decline in interest yield, but has also compressed equity holders’ return. The percentage of microborrower’s interest payments that goes to profits has declined from 20 per cent in 2004 to less than 10 per cent in 2011. Thus, though the return on assets was slightly higher as compared to commercial banks, the return on equity was lower.

Chaudhary and Rai had hypothesized that the higher than expected interest yield could be because of higher return on equity demanded by shareholders or surplus generation for financing growth. Given the low return on equity and higher than expected opex, it appears that the latter more prominently explains the deviation in the MFI model with the empirical study.
Though the scope and methodology of the two studies are different, observing the empirical trend in the paper by Rosenberg et al. with the MFI model developed by Chaudhary and Rai throws an interesting analysis. The comparison, among other things, highlights the need to understand the true cost of operations for a microlender to get a handle on the dynamics between interest yield and profitability.
—
- Rosenberg et al., “Microcredit Interest Rates and Their Determinants 2004-2011,” CGAP and partners, accessed July 19,2013, http://www.cgap.org/publications/microcredit-interest-rates-and-their-determinants
- MIX provides performance and financial information on microfinance institutions, funders, networks and service providers dedicated to serving the financial sector needs for low income clients. http://www.mixmarket.org/
- Nitin Chaudhary and Suyash Rai, “MFI Pricing and Valuation – an analysis of key drivers,” IFMR Trust, accessed July 19,2013, http://foundation.ifmr.co.in/2011/01/31/mfi-pricing-and-valuation-an-analysis-of-key-drivers/
- Chaudhary and Rai have considered a Twenty Branch Unit (TBU) as the building block of a microlender, thus assuming a zero growth model, where pricing is modeled for only one TBU
- Borrowing costs have increased for microlenders as more of their portfolio is funded through commercial borrowing. Rosenberg et al. also highlight that borrowing cost is not necessarily lower for microlenders who mobilize savings as the cost of savings mobilization can outweigh the decrease in funding cost


2 Responses
Dear Ravi Saraogi
Both these studies referred to with the given assumption and data asymmetry may be useful to the interest income analysis for rural financial institutions.
However, I am afraid on its applicability to Microfinance domain with the poor clients in the market . Being a social oriented micro financing , the focus is more on return/income to the poor clients from the loan utilization at field level given the
supporting environ . This return or income to the poor clients is the basic determinant of repayment – recovery chain leading to return to equity at institutional level .
The dynamics between interest yield and profitability assumes importance for any lending institution in the market with the viable clients and at the same time in the market with poverty segment, it is important to perceive deeply the dynamics between income generation ( IG from the given loan product/scheme) and repayment and again between recovery and return or income to loan asset regardless of interest rate. Again the actual sources of clients’ repayment either from IG or any other sources like money lender/fresh loan etccommon feature in this domain is often camouflaged in the glittering recovery rate which may not affect much on the return or income to lending
institution. The recovery data would reveal an apparent income at surface level but it is persistent debt or pseudo income in reality in many cases for the poor client. How to reckon this demand side non transparent phenomenon on the income factor in the MFI modeling? How to securitize or hedge the loan asset at poor client level in terms of
supporting infrastructure ( forward and backward linkages) for ensuring for its productivity and sustainable income and there by return to both the client and equity/shareholders as well with social justification in Micro finance domain unlike commercial financing with profitability. This kind of analysis merits the attention of NBFC-MFIs
In fine since the both the models delve on interest rate , I observe that it confines conceptually to micro credit only and concerned with pricing Micro credit not necessarily Micro finance as referred to in the title. Since Micro finance represents package of financial services such as micro savings, micro insurance , transfer payment , micro pension(of late ) , there is a need to focus in the financial research
on pricing or modeling MF with integrated products ( credit linked savings, insurance and other pro poor MF financial services ) for ensuring viability through diversified MF products and so return/income to both the financial institution in the supply side and the poor client in the demand side , instead of doing isolated micro credit lending
activity in MF realm in the supply side. Perhaps this paradigm shift in the MF
modeling would help financial inclusion also a sustainable one with appropriate products and services without subsequent exclusion.
Dr Rengarajan
Interesting. Perhaps MIX’s annual borrower growth data over the relevant period might shed some light on your conjecture about expansion being the explanation for the gap between prediction and result for operating expense.