
In the aftermath of the Global Financial Crisis, RBI took a major leap forward and set up a new Financial Stability Unit in 2009 specifically focusing on the measures to be taken for assessment and evaluation of financial system stability in the country. The main objectives of the Unit are to conduct macro-prudential surveillance of the financial system, to prepare Financial Stability Reports (FSR), to conduct stress tests on an ongoing basis and to develop regulatory frameworks and models for evaluating financial stability in India. The FSR contains an assessment of the resilience of the financial system and covers a variety of indicators such as asset quality, liquidity, macro-financial risk, soundness and resilience of banks, profitability and capital adequacy levels. Resilience is checked by performing a series of stress tests on banks’ books.
Objective:
The objective of this exercise is to design and implement a credit risk stress test on the scheduled commercial banks in India and achieve an understanding of the stability of the banking sector. To this end, we perform this stress test using publicly available data from annual reports and other publicly available data[1] for the year 2013-14. We also compare our results with those of the RBI disclosed in the Financial Stability Report, June 2014[2].
Balance sheet based approach
The balance sheet approach is the “natural” approach to stress testing for banks and other financial institutions. The reason is that balance sheet information is publicly available for financial institutions in a standardized format which also facilitates the comparison of institutions and groups of institutions. However, with all its advantages, this approach also has some drawbacks – it is not a completely forward looking approach; it does not capture all the risk drivers that might affect the performance of the bank in a stressed scenario.
Data
The relevance and accuracy of any stress-test exercise relies on the underlying data input. First, data availability defines the extent to which the exercise can cover various aspects of banks’ risk profile. The FSR uses data from the top 60 SCBs as they account for about 99% of all banking sector assets in India[3]. For the purposes of conducting balance sheet based stress test, we accumulated publicly available data from the Annual reports and Basel Disclosures of the top 60 Scheduled Commercial Banks in India. This exercise covered the evaluation of top 52 banks in the country due to lack of the availability of consistent data for 8 foreign banks. These 8 banks however do not contribute to more than 1% of the total assets of the banks in the country. In addition to this, we had also used the data from RBI’s Statistical Tables Relating to Banks in India.
Methodology[4]:
Stress tests are conducted to test the resilience of Banks against the impact of extreme stress scenarios. A typical stress test consists of 3 important steps:
- Designing a stress scenario
- Modelling the transmission of shock
- Understanding the result with respect to a benchmark or a threshold
The stress scenarios used in FSR (June 2014) for the purposes of a credit risk stress tests[5] on the banking sector are as follows:
- Shock 1: Increase in NPAs by 100%
- Shock 2.1: 30% of restructured assets become NPAs (Substandard assets)
- Shock 2.2: 30% of restructured assets become NPAs (Loss assets)
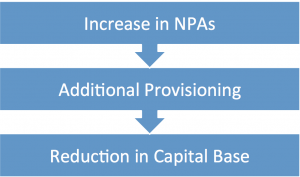
It is assumed that an economic shock increases NPAs and ultimately affects the Capital Adequacy level of the Bank[6].
Norms on prudential recognition requires banks to provision for assets on the basis of their quality. Therefore, any increase in NPAs would require the bank to set aside additional provisions in order to cover for any potential losses from these assets. These additional provisions are deducted from the capital base of the bank. This reduction in capital would affect the level of capital adequacy of a bank.
Shock 1: Increase in NPAs by 100%
This can be translated to 2 possible scenarios:
- The addition of new NPAs
- Slippage of standard assets to NPAs
As there is no clarity on which case to consider, we consider both cases:
Case 1: Addition of new non-performing assets
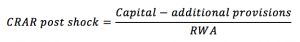
The new NPAs require additional provisions which are deducted from the capital base. Also the difference between the total value of the new NPAs and their additional provisions[7]is added to the total risk-weighted assets[8]. We assume that there is a proportional increase of substandard, doubtful and loan assets.
Below is an illustration of our approach for the calculations:
| Pre-shock | Post-shock | |||||
| Total Capital | 500 | Total Capital | 500 | |||
| Advances | Value | Provisions | Advances(new) | Value | Provisions | |
| – Standard | 5000 | 50 | – Standard | 5000 | 50 | |
| – Substandard | 20 | 5 | – Substandard | 40 | 10 | |
| – Doubtful | 20 | 15 | – Doubtful | 40 | 30 | |
| – Loss | 10 | 10 | – Loss | 20 | 20 | |
| Total | 5050 | 80 | Total | 5100 | 110 | |
| Additional provision[9] | ||||||
| – Substandard | 10-5 = 5 | |||||
| – Doubtful | 30-15 = 15 | |||||
| – Loss | 20-10 = 10 | |||||
| Total additional provision | 30 | |||||
| CRAR | CRAR | |||||
| – Capital coverage | 500 | – Capital coverage | 500-30= 470 | |||
| – RWA[10] | 5050 | – RWA | 5100-30=5070 | |||
| CRAR | 500/5050= 9.90% | CRAR | 470/5070= 9.27 % | |||
Case 2: Slippage of assets into the Non-performing asset category
In the second case, we assume that this increase in NPA is due to standard assets held by the bank becoming NPAs. We assume that there is a proportional increase of substandard, doubtful and loan assets.
Below is an illustration of our approach for the calculations:
| Pre-shock | Post-shock | |||||
| Total Capital | 500 | Total Capital | 500 | |||
| Advances | Value | Provisions | Advances(new) | Value | Provisions | |
| – Standard | 5000 | 50 | – Standard | 4950 | 49.5 | |
| – Substandard | 20 | 5 | – Substandard | 40 | 10 | |
| – Doubtful | 20 | 15 | – Doubtful | 40 | 30 | |
| – Loss | 10 | 10 | – Loss | 20 | 20 | |
| Total | 5050 | 80 | Total | 5050 | 109.5 | |
| Additional provision | ||||||
| – Standard | -0.5 | |||||
| – Substandard | 5 | |||||
| – Doubtful | 15 | |||||
| – Loss | 10 | |||||
| Total add provision | 29.5= (30-0.5) | |||||
| CRAR | CRAR | |||||
| – Capital coverage | 500 | – Capital coverage | 500-29.5 = 470.5 | |||
| – RWA | 5050 | – RWA | 5050 | |||
| CRAR | 500/5050= 9.90% | CRAR | 470.5/5050 = 9.31% | |||
Results:
Shock 1:
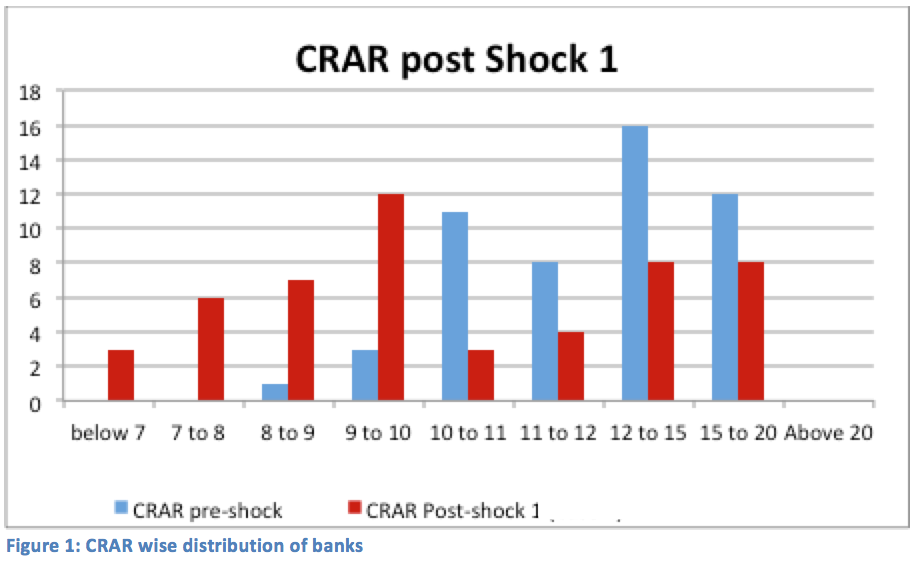
The stress test results under Case 1 seemed to produce results that were more consistent with the RBI FSR (June 2014) results as compared to Case 2. The Case 1 results revealed that 16 out of top 52 banks contributing to over 36% of the total banking asset would fail to meet the adequate capital requirements to cover the losses that may arise in the stress scenario. The shock assumed 100% increase in NPAs proportional to existing NPAs. The banks failing the stress test constitute 13 Public Sector Banks & 3 Private Sector Banks; out of which major hit was observed on two of the Public Sector Banks and one Private Sector Bank with their CRAR (Capital against Risk-weighted Assets Ratio) falling below 7% post shock. The Private SCB falling under this category had CRAR below the minimum requirement even pre-shock. Nine banks out of these 16 were seen to have CRAR post shock below 8%.
Below are graphs depicting the distribution of Banks’s post-shock CRARs and their comparison with the RBI’s FSR results for the same shocks.
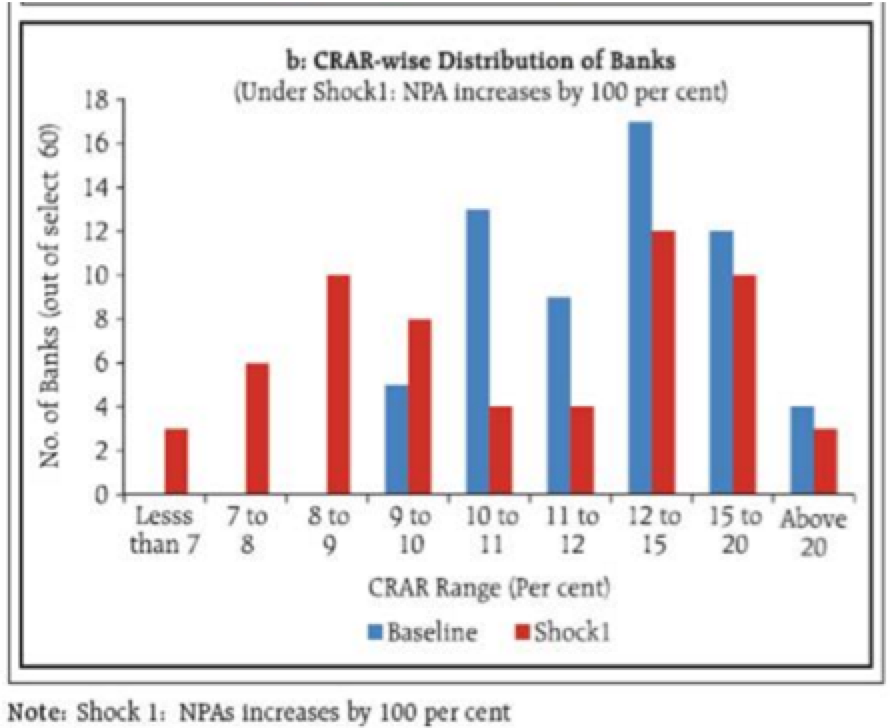
RBI’s FSR result
| Observations | Financial Stability Report | IFF stress test exercise |
| No. of Banks with CRAR below 9 | 19/60 | 16/52 |
| No. of Banks with CRAR below 8 | 9/60 | 9/52 |
| Assets held by failing Banks | 35% | 36% |
| Capital Loss | 15% | 12.25% |
| No. of banks between with CRAR between 9 and 11 | 12 | 15 |
Shock 2:
Shock 2.1 was aimed at measuring the impact of slippage of restructured standard advances to NPAs. In first case we considered 30% slippage of restructured standard advances to substandard advances which however did not show much adverse impact on capital adequacy of the banks.
However, Shock 2.2 showed 13 banks failing the stress test. In this case we measured the impact of 30% slippage of restructured standard advances to Loss NPAs.
Summary of results
Our results seem to fare well with the results of RBI’s Financial Stability Report. A summary comparison of the results of the stress tests with those of the FSR is shown below:
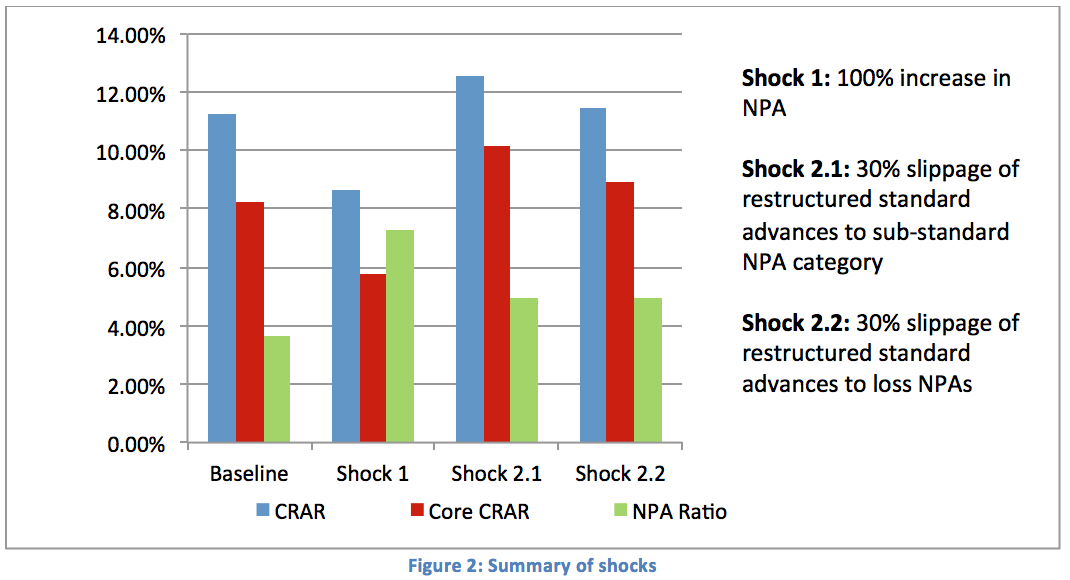
Our Result
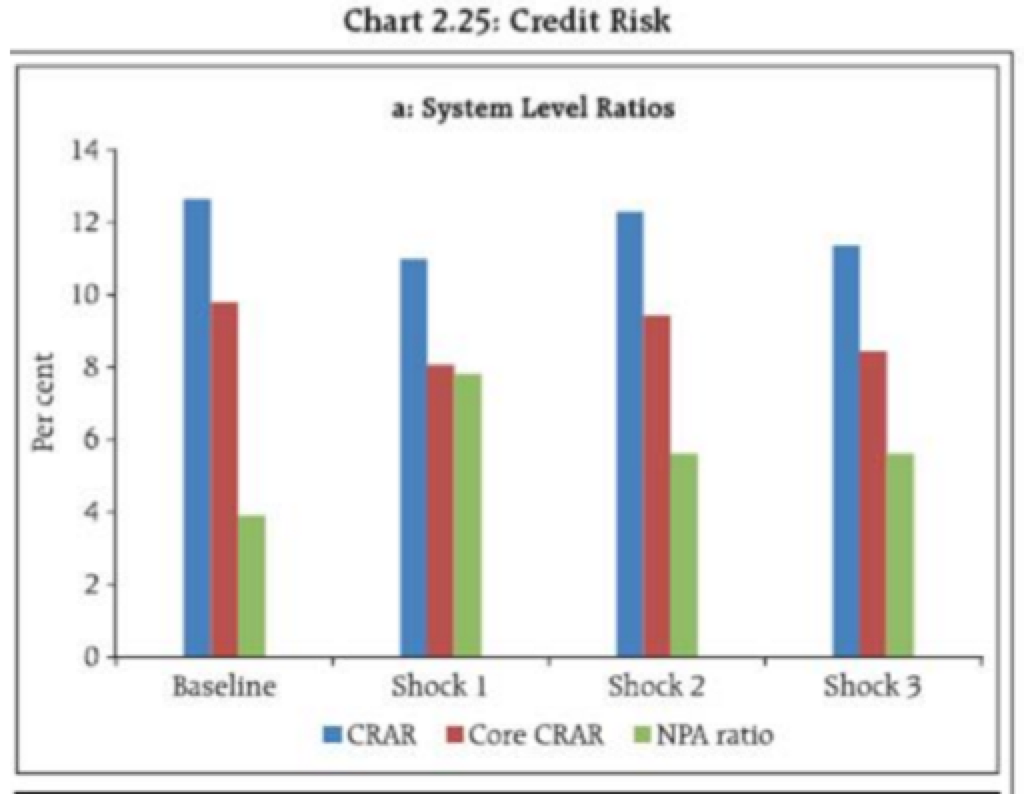
RBI’s FSR Result
These results are consistent, to a certain degree, with the results of the regulatory stress tests conducted by the RBI. However, we had to make a host of assumptions due to the lack of adequate data and information regarding the methodology involved in the stress tests conducted by the regulator. For example, there is lack of information regarding the design of the stress scenarios and their likelihood of occurrence.
It is also quite important to note that the most recent FSR (June 2015[11]) has changed the stress scenarios for the credit risk stress tests of the banking sector. The stress scenarios currently consider a 3 standard deviation increase in the Gross NPA ratio of the Bank. However, the concerns regarding clarity of the transmission of these shocks raised in this post still exist.
The public availability of stress test results for individual banks put out by the Federal Reserve in the aftermath of the global financial crisis served to regain public confidence in the regulator. While the European Central Bank[12] has published methodological details, as well as actual stress test results[13] on individual banks, (also done by the Federal Reserve[14]), it remains to be seen whether the RBI will put out methodological details on similar lines.
—
[1] Annual reports, Basel Disclosures and Data from RBI’s “Statistical tables relating to Banks in India”
[2] https://rbidocs.rbi.org.in/rdocs/PublicationReport/Pdfs/0FSR26062014F.pdf
[3] Financial Stability Report, June 2014, RBI.
[4] Our stress testing model was broadly based on Cihak, A Toolkit for Bank- by- Bank Analysis with Accounting Data. http://www.elibrary.imf.org/staticfiles/misc/toolkit/pdf/chap3.pdf
[5] These stress scenarios are based on the stress tests results published in the Financial Stability Report, June 2014, RBI. It is worthy to note that the most recent FSR considers only one stress scenario: that of 3SD change in Gross NPA ratio.
[6] A Guide to IMF Stress Testing: Methods and Models(2014), IMF
[7] Provisioning for standard assets is assumed to be 1% here. This is a conservative estimate as the provisioning of standard assets vary between 0.25%-1% depending on the asset class. For substandard, doubtful-1, doubtful-2 and doubtful-3 and loss assets, it is assumed to be 25%, 25%,40%,75% and 100% respectively. From RBI, Master Circular – Prudential norms on Income Recognition, Asset Classification and provisions pertaining to advances, 2014. https://rbi.org.in/scripts/BS_ViewMasCirculardetails.aspx?id=9009
[8] RWA changes with the change in provision as the risk weight is allocated to the advances before they are subcategorized into standard, substandard, doubtful and loss loans. Therefore, it is assumed that (New NPAs – additional provisions) will account for the risky part of the asset.
[9] In these illustrations, we have used a 75% provisioning for Doubtful assets
[10] Risk weights are assumed to be 100% for all advances
[11] https://www.rbi.org.in/scripts/PublicationReportDetails.aspx?UrlPage=&ID=821
[12] https://www.eba.europa.eu/documents/10180/669262/Methodological+Note.pdf
[13] http://graphics.wsj.com/european-stress-tests-2014/#co-operative-central-bank-ltd
[14] http://www.federalreserve.gov/bankinforeg/dfa-stress-tests.htm


One Response
Interesting reading. A couple of aspects though on asset classes. The big glitches in recent collapses of banks, either one-off (Barings) or systemic (like 2008) has been trading in securitised assets or securities. Here there a few glitches :
i) The primary lending and monitoring of sub-parts of loans, for example, happens elsewhere from the bank reporting its financials. Its difficult to imagine that the entire portfolio of assets will retain a credit-worthiness throughout its life.
ii) These traceable assets are subject to much more volatility that fundamentals of the loan justifies. Such volatility is related to macro-factors and are very often short term (sometimes just a few months). To illustrate, bonds of the PIIGS countries fluctuated by as much as 20-30% or more within months – actual paying ability of those governments could not have varied that dramatically on both directions within months.
While the latter is being addressed through other measures of the central bank(s), it creates retail consumer perceptions of failure and a run on the bank. No bank can typically tide a run in cash flow terms. Maybe it would be useful to have a guideline index that separates the fundamentals (cash paying ability of the bank) versus the volatile trading markets (that seem to work on perceptions or other mysterious factors!).
A bank heavily exposed on trading arena can be flagged differently from one that isn’t (this will address perception issues likely when a crisis occurs); similarly, the cash returning ability is insulated from market volatility.