In the previous post of this series on Event Risk & Loss Estimation, we discussed briefly the motivation and key modules of a framework for estimating capital against event risk. Before we discuss the approach and components of such a framework in detail, it is important to understand the nature of the extreme events and how such events impact borrowers, lenders and credit portfolios. In this post, we will discuss the former in the context of some of the extreme and not-so-extreme events. Not-so-extreme because either there may be some predictability in the timing of their occurrence or their impact may appear less extreme and more diffused- spatially as well as temporally. We will cover four natural disasters- Flood, Drought, Cyclone and Earthquake – in this post. We will discuss briefly the socio-political events in the next post along with a common investigation framework to evaluate the impact of events on borrowers and lenders.
Floods
India receives more than 70% of its rainfall over a period of four months1. In fact, the rainfall may not be evenly distributed during the season. This results in long dry spells followed by heavy rainfall in several geographies. Throughout history floods are the most recurrent natural disasters that cause havoc. A flood is defined as a phenomena in which water over flows its natural or artificial banks onto normally dry land, such as a river inundating its floodplain2. There are mainly four types of flood:
- Riverine Flood: This type of flooding is caused by overflow of water along the path of a river and mainly affects land area along the river bank. The frequent flooding in the Kosi River, also known as the sorrow of Bihar, is a typical example of riverine flood. The August 2008 flood in Kosi River was caused by a breach of an embankment of the river in Nepal. After the breach, the river changed its course to the one followed by it in 1930s in a very short time causing severe flooding over a large extant of land in Bihar3. Four major riverine flood prone regions are:
- Ganga basin
- Brahmaputra basin
- Narmada – Tapti basin
- Krishna, Godavari, Mahanadi and Cauvery basin
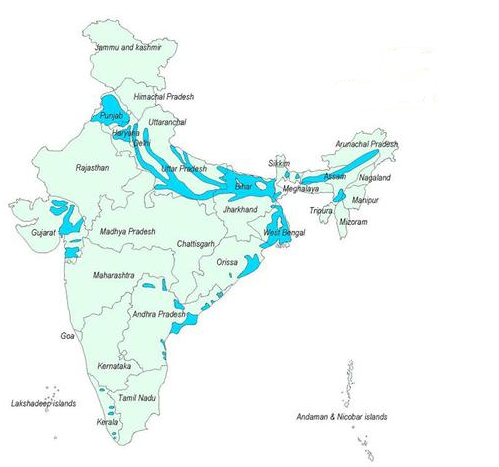
Figure 1: Flood Hazard Map of India4
- Coastal flood: Flooding caused by the ocean water driven inland by another natural cause such as storms, cyclones, tidal waves caused by earthquake (tsunamis), etc.
- Urban flood: There could be several reasons for urban flooding such as heavy rainfall, sudden release of water from a bund or dam, tidal waves, etc. However, the main underlying cause is usually the slow absorption of water by the land. The 2005 flood in Mumbai was an example of urban flooding.
- Flash flood: Such floods manifest in a very small time and usually without warning, hence the name. These are usually caused by heavy rainfall or release of water from a dam. The disastrous floods in the North Indian geography in the last few years were examples of flash floods.

Droughts
Drought, along with flood, is one of the most recurring natural disasters in India. The duality is not surprising since both are linked to rainfall cycles to a large extant. However, unlike floods and other disasters that we will discuss shortly, it is very difficult to identify the onset and end of a drought. In fact, there are multiple definitions of drought proposed from time to time based on the specific ‘water content’ requirement (of soil, for example) for various human activities5.
There are mainly three types of droughts6 and the definitions vary based on the type:
- Meteorological drought: Situation when the deficiency of rainfall at a meteorological sub-division level is 25% or more of the long-term average (LTA) of that sub-division for a given period. If the rainfall deficiency is less than 50%, it is classified as “moderate” drought; else, it is termed as “severe” drought7.
- Hydrological drought: It is a prolonged meteorological drought resulting in depletion of surface water from various reservoirs causing severe shortage of water for human and livestock needs8.
- Agricultural drought: It is a situation when rainfall and soil moisture are inadequate to support healthy agricultural crop growth9. This may be caused by a meteorological drought followed by a hydrological one.
(It is very tempting to suggest a fourth type of drought here- Political Drought- but we will leave it out of this post!)
It can be concluded from the above definitions that a meteorological drought instance may not be disastrous in isolation. However, a series of meteorological droughts or mismanagement of water resources may result in a hydrological drought over time10. This coupled with lack of irrigation resources may result in agricultural drought. Further, it should be noted that agricultural drought is also a relative term- it would depend on the moisture requirement of the crop grown in the affected area. These factors make the impact evaluation exercise for a drought on the economic activities a very difficult task. We will discuss in detail this issue in the next post of the series.
National Climate Centre (NCC) provides a good literature on popular methods for measuring the drought severity over a spatial unit in a report published in 201011. The report also provides the drought indices for 458 districts using the southwest monsoon season rainfall time series over the period 1901-2003.
Cyclones
Cyclones, one of the most recurring extreme weather events across the globe, are weather systems with wind speed exceeding 62 km per hour. Though cyclones are known by different names in different regions (hurricane in North Atlantic and East Pacific, Typhoon in West Pacific, and cyclone in Indian Ocean), the classification is mainly based on the wind speeds. For a detailed classification, one may refer to the Wikipedia page on tropical storms which provides a great deal of information as well as useful references on cyclones12.
India with a coastline of more than 7500 kilometres is one of the worst affected regions in the world with on an average nearly 370 million people exposed to cyclone disasters annually13. Cyclones are multi-hazard systems, i.e. multiple hazards are associated with a cyclone– high speed winds, torrential rains and inland flooding, and storm tide14. However the development, eventual landfall and potential impact of a tropical cyclone can be estimated more accurately relative to other natural disasters such as floods, drought and earthquakes. Though the cyclones can change their course or dissipate suddenly, the modern forecasting systems have enabled the governments and disaster management bodies around the world to take preventive actions to minimize the damage due to cyclones and associated hazards.
National Disaster Management Authority (NDMA) of India published a study in 2010 which suggested a cyclone hazard mapping of coastal districts in India based on the historical (1981-2008) occurrences of cyclones and the multiple hazards associated with them.
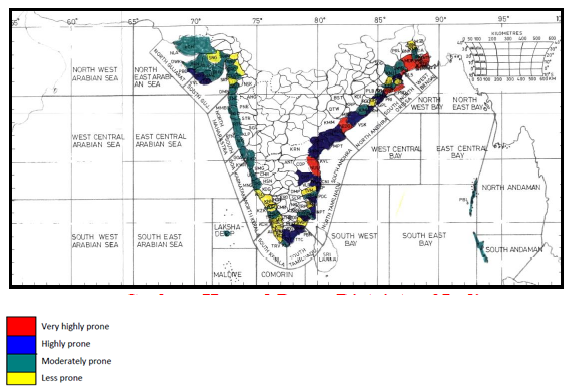
Figure 2: Cyclone hazard map based on multi-hazard model12
Earthquakes
Earthquakes are arguably the most fatal of the natural disasters. There is high amount of uncertainty attached to the timing, location and severity of an earthquake which makes preventive measures very difficult if not near impossible. Unlike floods, droughts or cyclones, there are no seasonal patterns or clustering in earthquake occurrences15. Earthquakes are caused by the sudden release of built up pressure in the earth’s crust in the form of an energy explosion that fractures the earth’s surface and creates seismic waves. The resulting ground acceleration is the main cause of damage caused by the earthquakes which impacts buildings, roads and other ground infrastructure. Like cyclones, earthquakes too have associated hazards, most common being the tidal waves, also known as tsunamis. The 2004 Tsunami was caused by one of the strongest earthquakes with magnitude of nearly 9.1 on Moment Magnitude Scale (MMS). The other two of the most disastrous earthquakes that India faced had magnitudes of 7.7 (Bhuj, 2001) and 6.2 (Latur, 1993).
Earthquake magnitude can be measured using seismograph (seismogram is the output graph of a seismograph!) which records the ground vibration. One of the most popular scales of measurement is the Richter scale, named after the seismologist Charles Richter16. The relation between the amount of energy and the scale reading is nonlinear. An increase of one magnitude signifies a ten times higher ground motion and nearly thirty times the energy17. Earthquakes with magnitude lower than 5.5 are usually not dangerous and may not cause any damage. An interesting fact is the frequency of earthquakes is far higher than intuition would allow us to guess; however, fortunately, most of these earthquakes have very low magnitude. A table based on the estimates of United States Geological Survey (USGS) is shown below.
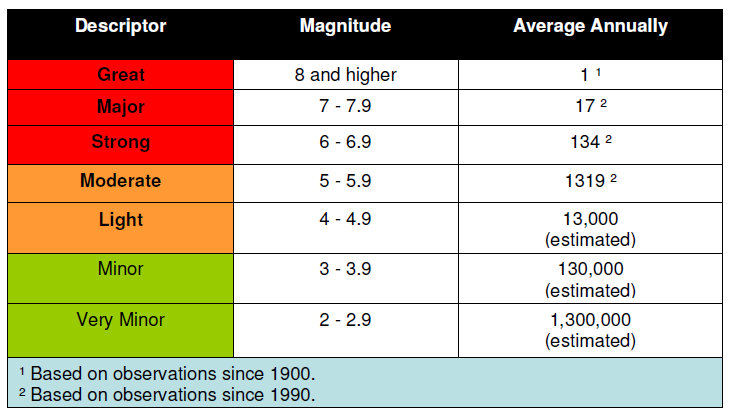
Figure 3: Estimated Earthquake frequency
The earthquake hazard map of India divides the region in five seismic zones.
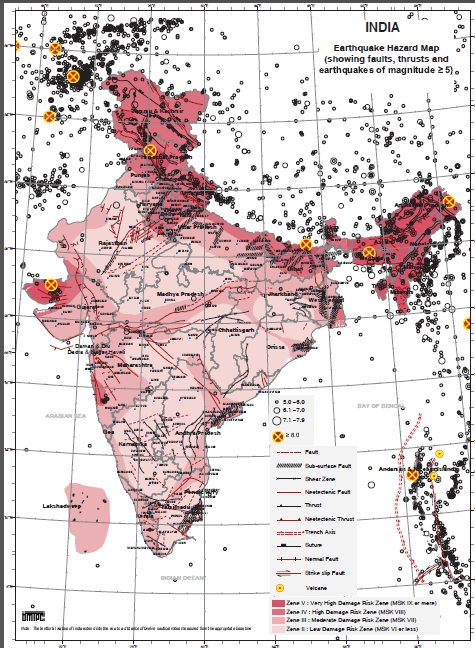
Figure 4: Seismic Zones of India18
Evaluating the impact on portfolio
Can we actually use a common investigation framework to evaluate the impact of such events? Though the extreme events listed and discussed above, and others not mentioned here, may differ significantly in nature, a common framework for investigation can be used to understand how such events impact portfolio performance of a credit institution. In the next post of the series we will discuss such an investigation framework.
—
We would like to thank Divyasree PK of IIT Madras who worked on the topic during her internship at IFMR Capital.
References:
- http://agricoop.nic.in/DroughtMgmt/DroughtManual.pdf
- http://saarc-sdmc.nic.in/pdf/flood.pdf
- http://www.indiaenvironmentportal.org.in/files/The%2018%20August%202008%20Kosi%20river%20breach.pdf
- http://www.cddrm-ncdc.org/e39621/e39678/
- http://ijset.com/ijset/publication/v1s4/p%20149-157%20surendra%20published%20paper.pdf
- National Commission of Agriculture in India
- National Commission of Agriculture in India
- http://www.nrsc.gov.in/pdf/Chap_13_Droght.pdf
- http://www.nrsc.gov.in/pdf/Chap_13_Droght.pdf
- http://sandrp.in/otherissues/Maharashtra_Drought_2012_13_worse_than_1972_March2013.pdf
- http://www.imdpune.gov.in/ncc_rept/RESEARCH%20REPORT%2013.pdf
- http://en.wikipedia.org/wiki/Tropical_cyclone#Hurricane_or_typhoon
- http://ncrmp.gov.in/ncrmp/Cyclone_Impact.html
- http://ndma.gov.in/images/cyclones/cyclonepronedistrict.pdf
- However, there are some studies which suggest that weather changes or human activities may seasonally impact the seismic activity, e.g. https://www.sci.hokudai.ac.jp/grp/geodesy/top/research/files/heki/year03/Heki_EPSL2003.pdf
- The Moment Magnitude Scale (MMS), developed in 1972, is commonly used now. However, both the scales are logarithmic and have similar characteristics for medium magnitude earthquakes. For a good account please refer to the Wikipedia page: http://en.wikipedia.org/wiki/Moment_magnitude_scale#Comparison_with_Richter_scale
- http://saarc-sdmc.nic.in/pdf/earthquake.pdf
- http://www.hpsdma.nic.in/ResourceList/Maps/EqIndia.pdf