
How do spatial parameters like distance and accessibility impact financial inclusion? How can an organisation striving to achieve financial inclusion locate itself strategically such that it becomes truly inclusive in every sense of the word?
When Shilpa Bhaskar and team visited a KGFS branch on an assignment, they noticed that the product renewals by customers who were in villages around 4 or more kilometres away was comparatively lower than by the customers who were close by. This was despite the fact that enrolment penetration was high across these areas.
This might not appear unusual at first look, as it is understandable that frequency of visit thins out as one goes further away from the office of the service provider. However, in this case, the said village was specifically mapped to the KGFS branch. This means that the service area of the branch was fixed and the branch was dedicated to serve customers from these areas and yet customers did not make full use of it. The team went back and decided to look into this a bit deeper.
They then learnt that, the existing method of fixing a branch service area as an approximate five-kilometre radius purely based on political map boundaries and relying on secondary data sources and manual recces could be made more efficient. Though the distance may be optimal, there could be other factors in play. For example, though the distance to the branch was less, the customers might not have access to bus services and might have to cross flooded fields to reach the KGFS branch. Or the commercial centre of the said village could be on the other side and villagers hardly found any reason to travel in the direction of the branch.
They also learnt that purely relying on secondary data for details such as population and occupation was not enough. Usually, before optimally locating a KGFS branch, demographic details were collected from the Village Administrative Officer and the Panchayat. Branch locations were then chosen based on this data. But unfortunately, one is a revenue office and the other is a development node. There were clear differences in the way these two offices looked at the same data. There had to be a way to triangulate and arrive at the right way of looking at this data. There seemed to be no better way than doing it first-hand.
When IFMR Rural Channels, the current licensee of the KGFS model, decided to open a new KGFS entity in Krishnagiri, the team decided to map the entire service area from scratch.
What followed next was an intense mapping exercise (the details of which will be explained in Part 2) of the proposed branch locations of the new KGFS entity. The exercise involved manually geo-tagging all important locations in the village along with photographs on Google Earth.
While the exercise was initiated to just map the service area and help identify the ideal branch locations that would help achieve its mission, the same has now grown in size and the spin-offs could lead to interesting and impactful developments.
Along with mapping every household in the village, the team decided to geo-tag details of infrastructure and public utilities. A team of surveyors has mapped out every single bank branch, school, telephone exchange, medical facilities, and bus stops along with details of economic activities at the village level, block level and at the district level.
The result is a detailed yet simple and intuitive map visually representing every important economic detail in the village.
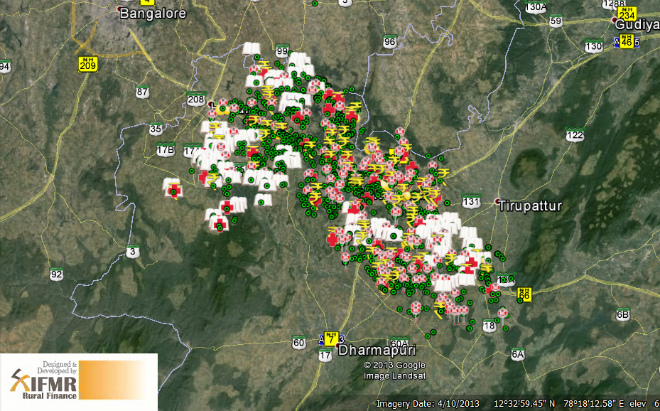
(Map view of Krishnagiri district – Bus stops, financial institutions, Medical facilities, schools have been manually geo-tagged.)
The KGFS entity can now use this data and map to plan its annual operations and deploy a very detailed and tactical plan to ensure financial services delivery reaches the remotest of the locations.
(In Part 2 we discuss in detail the mapping methodology and the possible uses of the outcome of the exercise.)


4 Responses
IS THIS MAPPING BASED ON LOCATION OF POSSIBLE CLIENTS OR PREFERENCE OF ESTABLISHING AN OFFICE ???????????
The mapping process helps identify locations of potential customer agglomerations and hence, set up our network of branches based on that. So it helps achieve both.
Good point. Distance = time taken plus cost, not the terrain length. In fact in public services delivery too, its not about size and location – if a fire truck gets there in 10 mins is more relevant than if its 1 km or 5 km away.
It may be handy to apply the same technique that a Domino’s outlet takes to its service area – delivery in 30 mins being the criterion. It charts out what’s possible for its bike crew to get there. So on a spatial map, distances look unequal, but it keeps its service promise.
Very interesting inference from the study that geographical location of the proposed branch should not be simply based on standard KM range normally being followed by bankers. One way of searching and locating a branch could be by using Bayesian theory (BT). Of course, BT is generally used to precisely to search and locate the lost object. It may need to be tweaked to suit the needs of the organisation which wants to locate its branch that would give most optimum business. This would mean developing set of hypotheses which among other things include the infrastructure development, connectivity, education level of people, appreciation of financial management etc.