
This post is the second in a series on Social Security for the Indian Unorganised Sector. The series will look at the challenges in the current implementation of social security schemes in India, and aim to provide a comprehensive framework for effective design, ownership, governance and delivery. This series is based on the report “Comprehensive Social Security for the Indian Unorganised Sector: Recommendations on Design and Implementation” authored by IFMR Research – Centre for Microfinance & IFMR Finance Foundation.
Why are take-up rates for social security schemes such as Aam Aadmi Bima Yojana (AABY) life insurance and NPS-Swavalamban (NPS-S) pension doggedly low in India? What prevents a customer from investing Rs.1,000 in an NPS-S account and doubling her investment through a matching government contribution? While there are significant flaws in the delivery and implementation architecture of social security schemes in India (discussed in the first post of this series), this post argues that customers’ aversion to these products could be rational and can be partially explained by the low levels of protection offered by these schemes. We examine two products below- life insurance and public pension.
(For an overview of the schemes discussed in this post, click here).
Life Insurance
The purpose of life insurance is to help households tide over the shock of loss of income due to the unexpected death of an income earning member. The extent of life and accident cover required for an individual is closely tied to the individual’s ‘human capital’, defined as the net present value of the future real expenditure and earning streams associated with that individual. An individual’s human capital reflects the loss of net earnings to the household in event of her death. Since an individual’s human capital is closely tied to multiple idiosyncratic variables like age, education and skill level, the task of public policy is to choose the human capital associated with a particular age and income profile below which it is considered infeasible for a household to function effectively upon the death of an income earner.
In order to make this assessment, we analyse the human capital matrix across different ages and incomes . The table below provides the value of human capital for ages ranging from 20 to 55 years grouped by income quintiles. In view of the fact that social security is designed to provide a minimum cover in case of the income-earner’s death, it is pertinent to focus on the human capital of the lowest income quintile (Column 2 in the Table below).
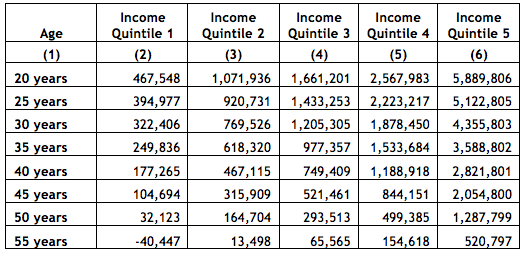
Let us compare this with the coverage provided under current social security schemes in India. The coverage provided for natural death under the AABY is Rs. 30,000, which according to the human capital calculations does not provide adequate cover for even a 50 year old in the lowest income quintile. Considering the fact that a younger income earner’s death will have a tremendous impact on the well-being of the household, as evidenced by the human capital calculations, it is clear that the present coverage under life insurance is woefully inadequate.
While there may be financial constraints that prevent extant life cover under social security from being set at this level, it is useful to articulate this – the human capital of a 40 year old in the bottom quintile should be, at minimum, the life insurance coverage goal to work towards over a specified period of time.
Public Pension
The purpose of pension cover under social security is to secure a minimum post-retirement income for an individual. In order to arrive at such a pension floor under social security, we analyse the post-retirement corpus required by individuals across age groups- ranging from 20 years to 55 years- in the lowest income quintile. Our assumptions are based on the current structure of the NPS-S product- customers contribute Rs. 1,000 per annum into their NPS-S account and that the government fully matches the individual’s contribution for the first five years. The customer’s savings in NPS-S are invested in two assets- debt (85%) and equity (15%).
As Column 4 of the table below shows, the expected return from investment in NPS-S for a 20 year old covers only about 31% of her post-retirement expenditure. If the aim of social security pension is to secure a minimum post-retirement income, the present scheme clearly falls short of this objective.
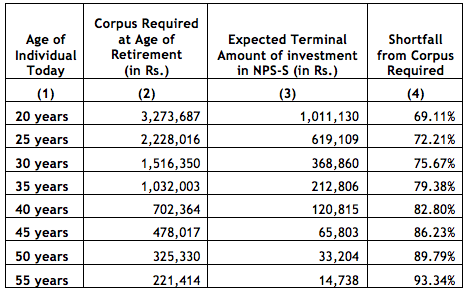
Without a perpetual matching contribution from the government, NPS-S does not provide enough incentive for a person to join the scheme. As the report of the Committee to Review Implementation of Informal Sector Pension (CRIISP) notes, there is strong economic logic to extending the matching contribution from GoI for perpetuity . For instance, an inflation-indexed matching contribution from the government would enable a 20-year old to reduce the shortfall from her minimum corpus to 57.5%, a reduction of 11.5% from the current state. Furthermore, the large shortfall is partly a result of the conservative investment mix of the scheme. We find that moving to the life cycle investment mix used by NPS-Main, together with inflation indexed matching contributions, would allow a 20-year old to reduce her shortfall to 14.5%.
As a general principle for pensions under social security, we propose this- if the aim of pensions under social security is to guarantee a minimum post-retirement corpus, a pension product under social security for the unorganised sector should cover, at minimum, the post-retirement expenditure of individuals in the lowest income quintile.
While there are significant challenges to be overcome in the delivery mechanism, ownership structure, and governance of social security schemes in India, better scheme design that adhere to the principles articulated above could offer all citizens minimal levels of guaranteed financial protection under social security.
—
Endnotes:
- This analysis has been performed on data from a financial services firm that is operational across rural districts in three states of India for a sample of over 200,000 households.
- A perpetual matching contribution provides pension in the informal sector some parity with the formal sector, popularly known as the employees’ provident fund scheme. Currently, all formal sector employees covered by the EPFO are also covered by the Employees’ Pension Scheme, 1995 under which the Government of India contributes 1.16% of their wages (subject to a monthly cap of Rs.6500) towards their pension. Thus, there is every reason to accord the same treatment to the persons in the informal sector to whom NPS applies. For a detailed analysis of the economic logic behind this, refer to the CRIISP Recommendations Pages 45-46 – Available here: http://pfrda.org.in/writereaddata/linkimages/CRIISP%20Report9681894859.pdf
- The life-cycle investment mix varies the proportion of investment in the three classes of assets according to the age of the customer and shifts investment from riskier assets (80% of the contribution is invested in equity, and corporate bonds for a 20-year old) to safer instruments (80% is invested in government securities for a 55-year old) as the customer ages.


2 Responses
This is an excellent blog post.
>>>> if the aim of pensions under social security is to guarantee a minimum post-retirement corpus, a pension product under social security for the unorganised sector should cover, at minimum, the post-retirement expenditure of individuals in the lowest income quintile. <<<<
This prescription does not take into account the effect of inflation:
When you put theoretical numbers on a compound interest chart, it looks like this:
[For chart click the link at bottom]
If You Invest $5,500 Each Year for 30 Years, Totaling $170,500, It Will Turn Into $732,674 If You Earn 8% Annual Compounding Interest
Take a look at stock market returns since the year 2000.
Adjusting for inflation, the market is only up 8.4% over the last 14 years. That’s a
lousy 0.6% return per year.
How does your compound interest chart look when earning 0.6% per year?
Just because the historical return of the market may be 8%, doesn’t mean it will
continue to return 8%.
Especially when the global economy has changed so much since the financial crisis started, and many more changes are sure to come in the next 30 years.
https://theelevationgroup.com/why-financial-advisors-lie/
Also the role of structure of money needs to be understood. The inevitability of inflation is attributable to structure:
http://topdocumentaryfilms.com/money-as-debt-promises-unleashed/