
In the recent years, the Government of India has focussed on promoting a cashless economy as part of its Digital India programme. The government has taken a number of steps to promote digital payments for availing government services[i] and also encouraged digital payments among people[ii]. In this blog post, we present some data and trends of digital payments in India. The primary sources of data for the various tables and charts in this post are the Payment System Indicators published in the monthly Bulletin of the Reserve Bank of India (RBI)[iii] and the regular statistics released by the National Payment Corporation of India (NPCI)[iv].
The most important modes, based on the volume of transactions, of retail digital payments prevalent in India, are the following.
- Credit Cards
- Debit Cards
- National Electronic Fund Transfer[v] (NEFT)
- Immediate Payment Service[vi] (IMPS)
- Mobile Wallets (M-wallets)
- Unified Payment Interface[vii] (UPI)
Table 1 below shows the total number of transactions and the total value of transactions in the month of March 2018 for all the above payment modes. The table also shows the average value per transaction for each of these modes. It is of note that the average transaction size for NEFT is over Rs. 1 lakh (100,000) while for all other modes the average is less than Rs. 10,000. Hence, considering the significantly large average transaction size, NEFT is not comparable to the other modes of transaction as a retail digital payment mode.
|
Volume of Transactions (in millions) |
Value of Transactions (in billion Rs.) |
Average transaction size (in Rs.) |
|
| NEFT | 212.0 | 22540.8 | 106319.1 |
| IMPS | 110.2 | 1038.0 | 9423.6 |
| Debit Card at POS | 318.9 | 418.6 | 1312.5 |
| Credit Card at POS | 127.3 | 443.1 | 3480.8 |
| Mobile Wallets | 268.8 | 101.0 | 375.6 |
| UPI | 178.1 | 241.7 | 1357.6 |
Apart from the above six highlighted modes of payments, there are some other modes also available in India which are not as large in terms of the volume of transactions. Aadhar Pay or Aadhar Enabled Payment System[viii], pre-paid instrument cards and mobile banking services through Unstructured Supplementary Service Data (USSD) channel[ix] are some other modes of digital payments available in India.
The following two charts show the trends in the volume, i.e. total number of transactions, and the total value of these transactions over from FY 2013-14 to FY 2017-18 for the predominant retail modes mentioned in the table.
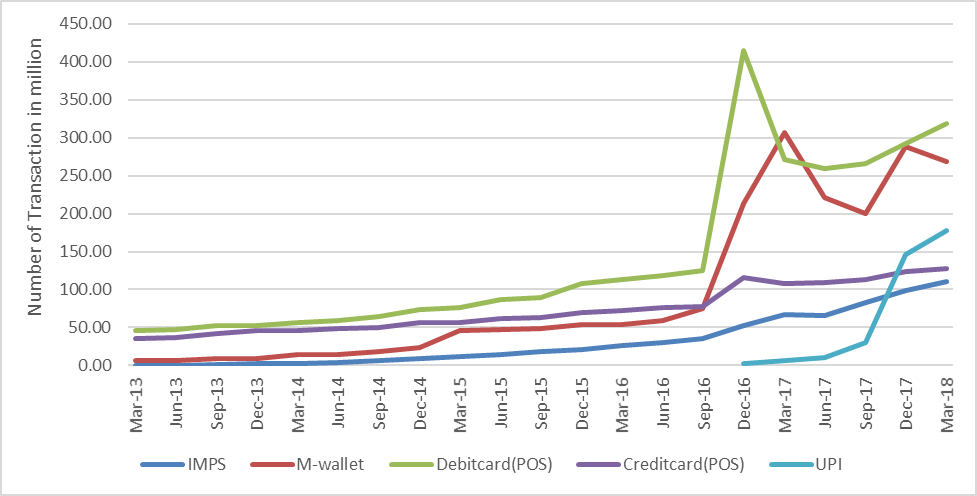
Chart 1: Growth in Volume of Transactions between March 2013 and March 2018
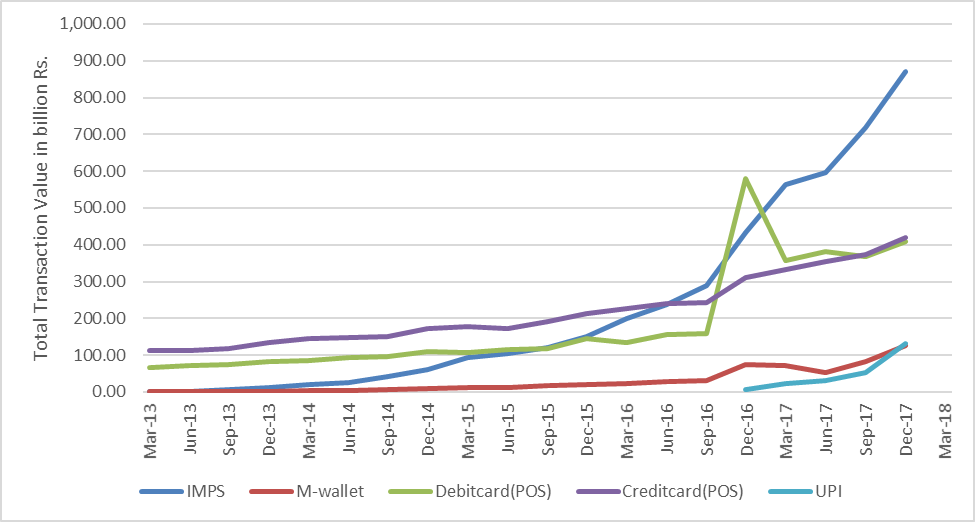
Chart 2: Growth in Total Value of Transactions between March 2013 and March 2018
These charts show that digital payments have grown significantly in the past 5 years. The charts also show that there is a significant jump in growth between September and December of 2016, which can be attributed to the demonetisation of Rs. 500 and Rs. 1000 notes on 8 November 2016.
While the total volume and value of transactions have continuously grown in the past 5 years, the average transaction size has remained largely stable for mobile wallets, debit cards, and credit cards, as shown in Chart 3 below. For IMPS, the average transaction size has more than doubled between 2013 and 2018. In the case of UPI though, the average transaction size shows the reducing trend.
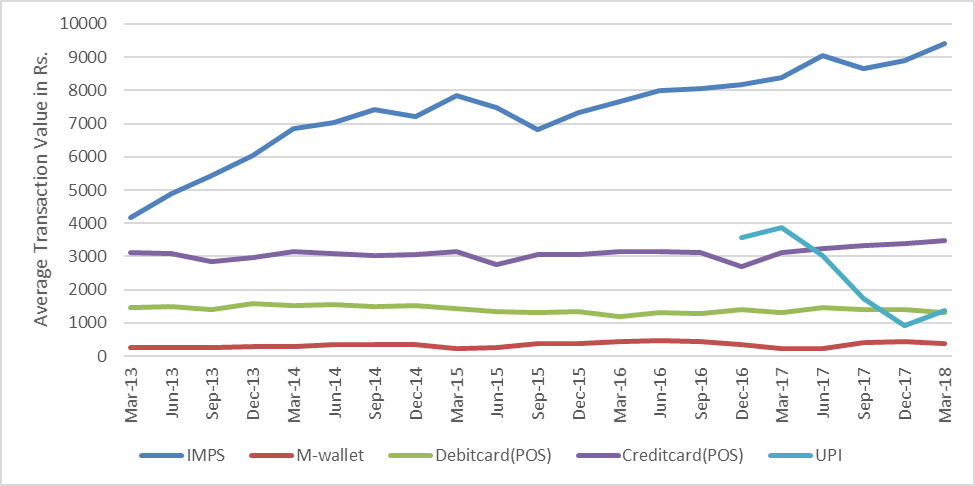
Chart 3: Trends in Average Transaction Size across various modes of payment
Chart 4 shows the growth in the number of credit and debit cards in the past 5 years. It must be noted that unlike the case of transaction volumes and value, there is no significant jump in the issuance of cards post-November 2016. On the other hand, the number of points of sale has doubled between September 2016 and December 2017, as shown in Chart 5.
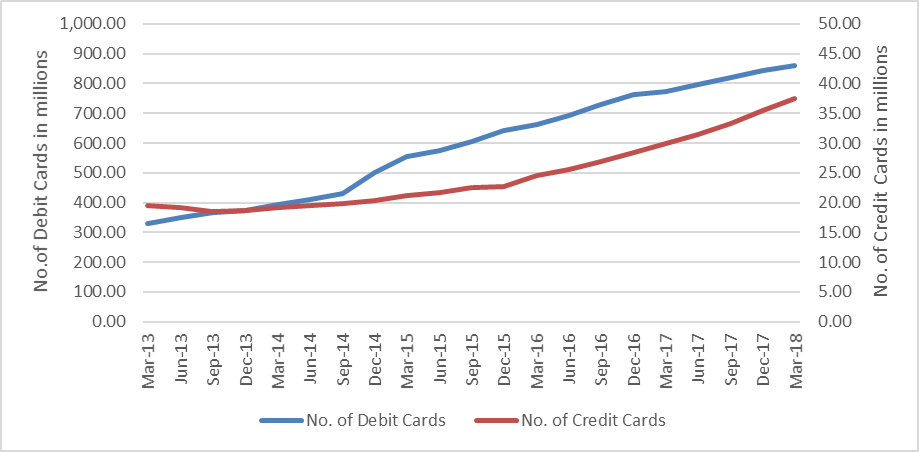
Chart 4: Total number of credit and debit cards
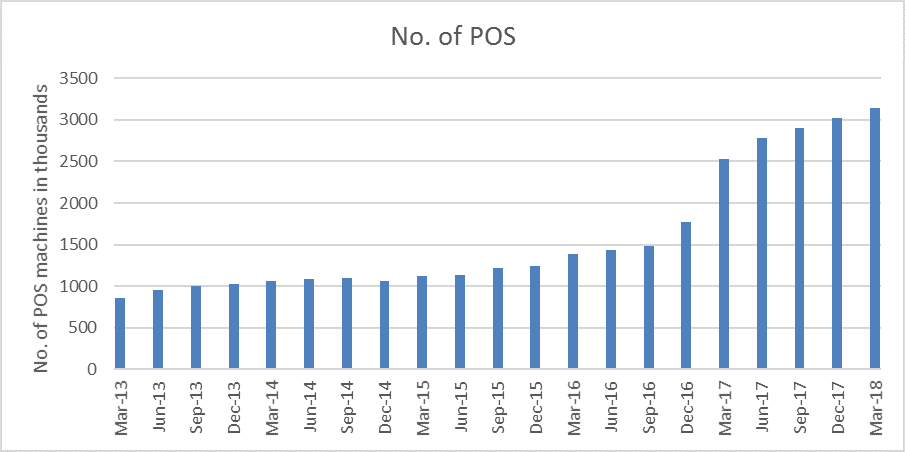
Chart 5: Total number of Points of Sale
While the total number of debit cards issued is close to 850 million and the number of credit cards is about 35 million as of March 2018, their activation rates are low. In 2016, the activation rates for debit cards was less than 10% while that of credit cards was less than 40%[x]. These rates have risen post demonetisation but remain very low overall[xi].
In the last year, we have seen a number of developments in the digital payments market. Arguably, the biggest change may be the rise of UPI as a payment mode. The open architecture of UPI has also attracted large technology companies like Google and Facebook to enter the digital payments space in India – with Google Tez application and integration of payments into Whatsapp messaging service respectively. While transaction volumes for mobile wallets have seen a huge jump post demonetisation, the recent expiration of the deadline for full KYC registration for all mobile wallet users may cause a decline in their user base[xii]. At the same time, the upcoming interoperability across different mobile wallet service providers may increase adoption and usage[xiii]. The RBI has also recently mandated that all digital payment system providers will have to store all payments data in India[xiv].
As the digital payments market continues to grow, we will be regularly looking at the available data to track and analyse the impact of new regulations, technologies and consumer choices on digital payments as it evovles.
—
[i] http://cashlessindia.gov.in/promoting_digital_payments.html
[ii] http://cashlessindia.gov.in/promoting_digital_payments_people.html
[iii] https://dbie.rbi.org.in/DBIE/dbie.rbi?site=publications
[iv] https://www.npci.org.in/statistics
[v] https://rbi.org.in/scripts/FAQView.aspx?Id=60
[vi] https://www.npci.org.in/product-overview/imps-product-overview
[vii] https://www.npci.org.in/product-overview/upi-product-overview
[viii] http://cashlessindia.gov.in/aeps.html
[ix] http://cashlessindia.gov.in/ussd.html
[x] https://www.visa.co.in/dam/VCOM/regional/ap/india/global-elements/documents/digital-payments-india.pdf
[xi] https://the-ken.com/story/visa-and-mastercards-fomo/
[xii] http://www.business-standard.com/article/companies/mobile-wallets-may-lose-40-users-as-kyc-deadline-ends-118030100022_1.html
[xiii] https://www.thehindubusinessline.com/money-and-banking/wallets-to-become-interoperable-soon/article23763056.ece
[xiv] https://www.rbi.org.in/Scripts/NotificationUser.aspx?Id=11244&Mode=0


2 Responses
Great post Sansiddha! What does data look like for card-not-present transactions (total card transactions minus the POS transactions maybe)? This subset I think would be a good comparator to look at against the UPI numbers as UPI does not have the issue of card activation that you point to. The card-not-present transactions are likely to give a good sense of card usage for e-commerce, regular subscription payments, card-on-file payments, and over-the-phone transactions, among others.
Unfortunately, RBI does not publish data differentiating between card-present and card-not-present transactions. NPCI provides some data regarding usage of Rupay Cards at Points-of-sale and e-Commerce. In 2017-18, total POS transactions with Rupaycards numbered about 460 million, while at e-Commerce the number was 208million.
In my view, card-not-present transactions may not be a very good comparator to UPI. UPI also enables receipts via QR-codes which merchants can show at their shops. UPI app providers like PhonePe and Google Tez do recruit merchants to use their apps to receive and make payments. A number of merchants also took up BHIM due to the cashbacks and rewards available. In these scenarios, UPI competes with card-present transactions of debit/credit cards, along with transactions using mobile-wallets. Also, UPI also provides an alternative to using IMPS/NEFT by enabling peer-to-peer transactions. UPI, to some extent, seems to be competing against all other forms of digital payments.